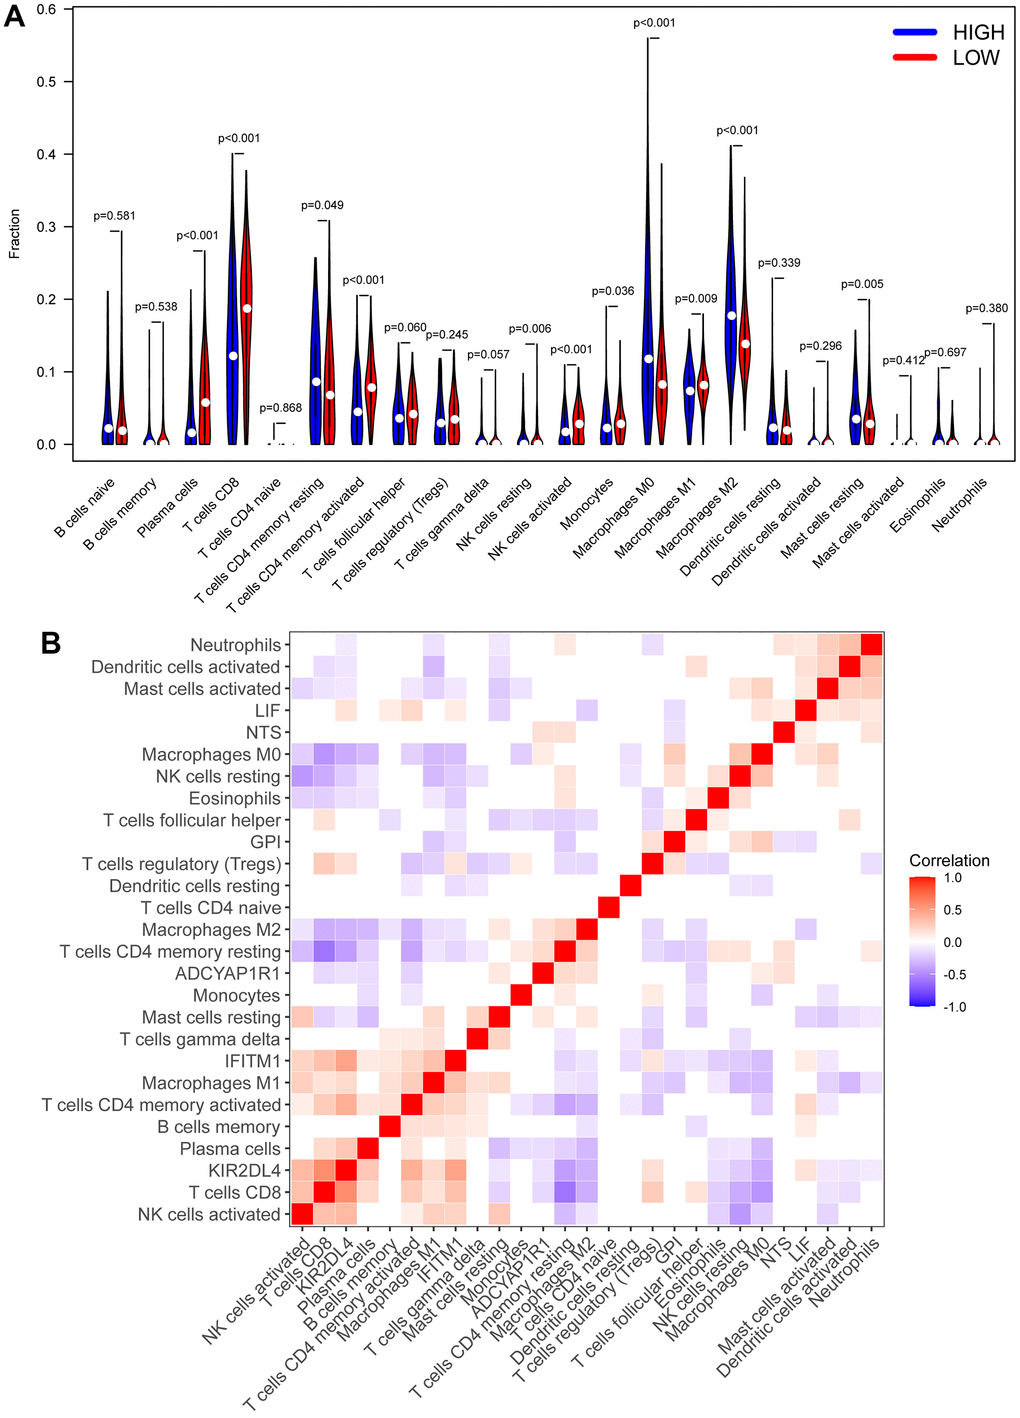
Figure 7.CIBERSORT analysis. (A) The heatmap of immune cell infiltration in high RS samples and low RS samples. Red represents low RS samples, and blue represents high-risk samples. (B) Correlation analysis between different immune cells and biomarkers.