Submit an Article
Navigate
Home
Editorial Board
Editorial Policies
Current Volume
Archive
Scientific Integrity
Publication Ethics Statements
Interviews with Outstanding Authors
Newsroom
Sponsored Conferences
Podcast
Contact
Special Collections
Submit an Article
Online ISSN: 1945-4589
Research Paper
|
Volume 16, Issue 1
|
pp. 911–927
Identification of immune-related genes and integrated analysis of immune-cell infiltration in melanoma
Back to article
Figure 5
(5 of 8)
−
100%
+
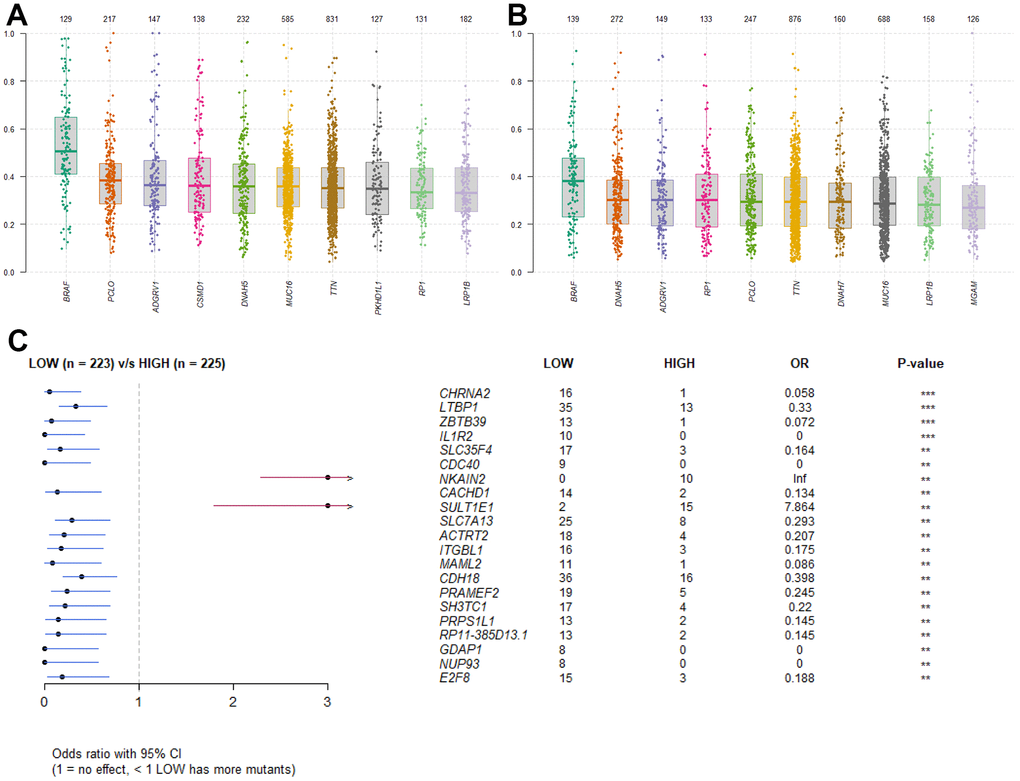
Figure 5.
Somatic mutation analysis.
(
A
) Boxplot of VAF in high RS group. (
B
) Boxplot of VAF in low RS group. (
C
) Forestplot of mutant genes in different groups.