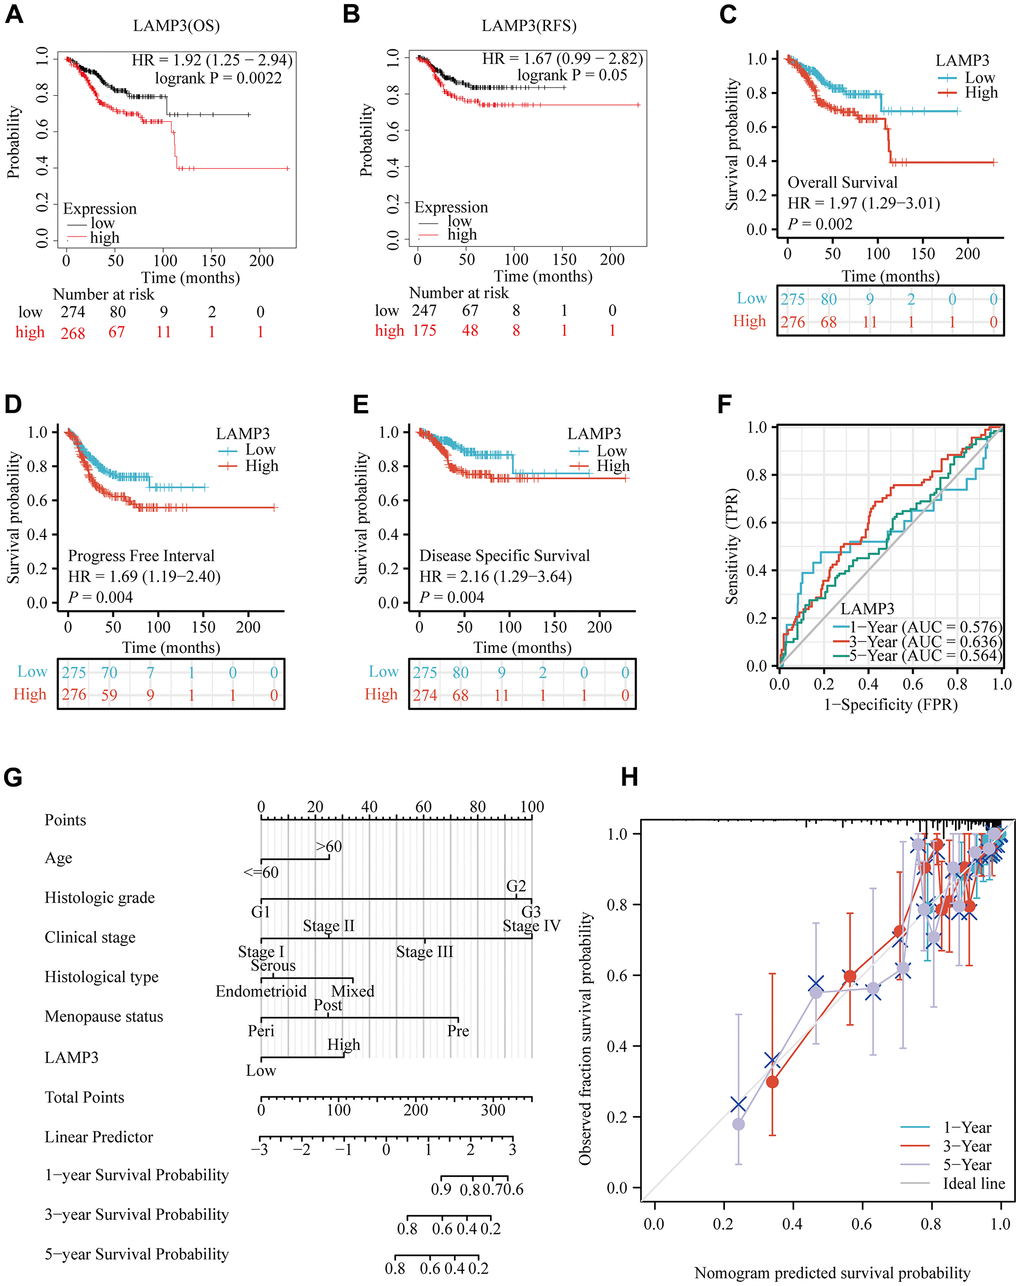
Figure 3.Prognostic value of LAMP3 in UCEC patients. (A, B) Demonstration of the relationship between LAMP3 expression and survival of UCEC patients on the basis of Kaplan-Meier plotter database. (C) Overall survival, (D) Progress free interval, (E) Disease specific survival of LAMP3 in UCEC with TCGA data. (F) A time-independent ROC curve demonstrates the predictive power of LAMP3. (G) A column line graph presents the impact of clinical features and LAMP3 expression on the prognosis of UCEC patients. (H) Calibration curve of the column line graph.