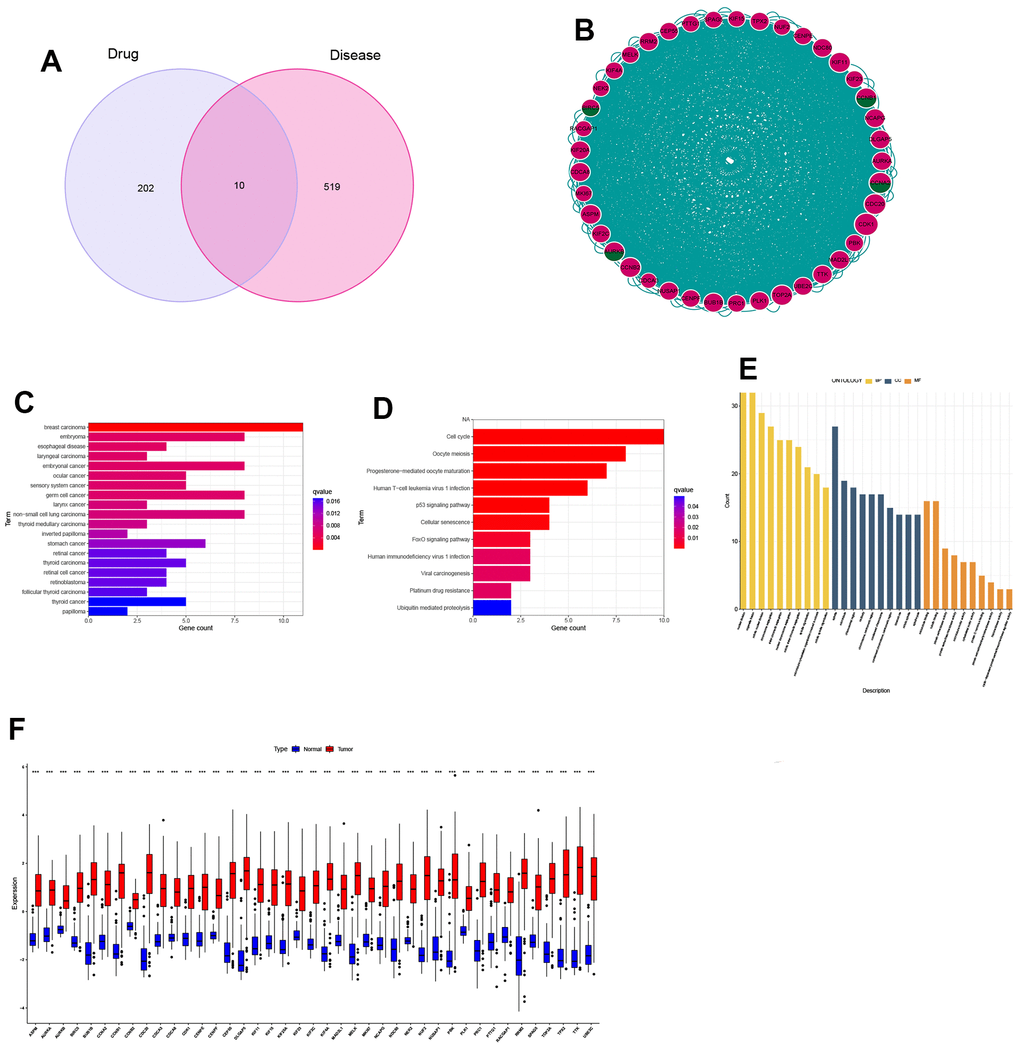
Figure 3.Identification and expression analysis of hub genes. (A) Venn diagram of drug targets and disease genes; (B) Protein-protein interaction (PPI) network of 41 hub genes; (C) DO analysis; (D) KEGG analysis; (E) GO analysis; (F) Gene expression between normal and tumor tissues.