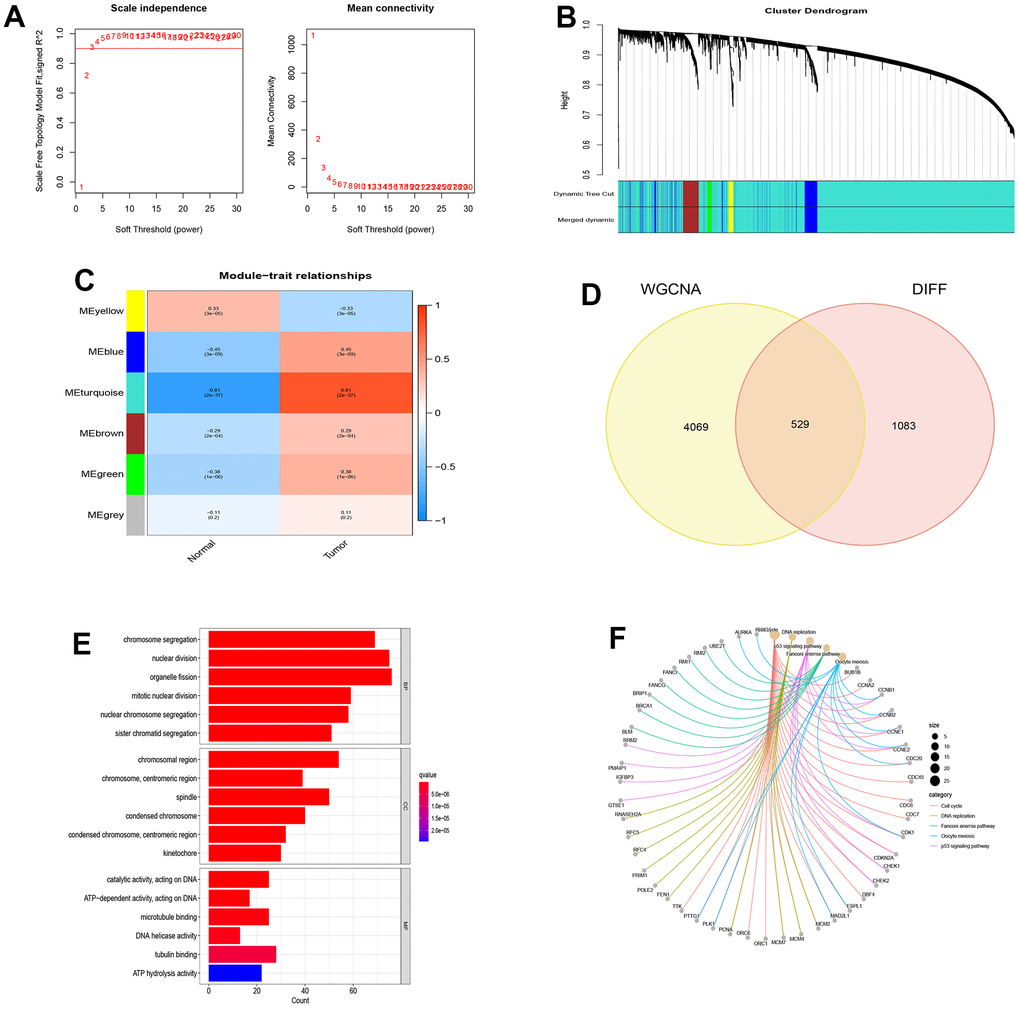
Figure 2.WGCNA analysis and module identification. (A) Scale-free exponent and average connectivity of different soft threshold powers (β); (B) Construction of gene co-expression modules; (C) Correlation analysis between different modules and tumor tissues; (D) Venn diagram of WGCNA and differentially expressed genes; (E) GO analysis of disease genes; (F) KEGG analysis of disease genes.