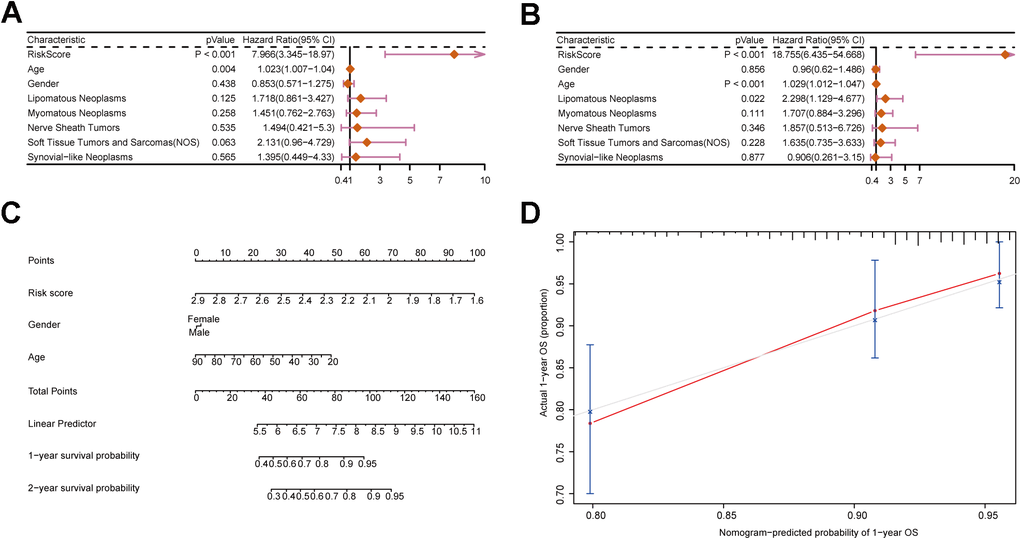
Figure 5.Construction of a nomogram incorporating clinical characteristics. (A, B) Forest plots displaying clinical characteristics and risk scores. (C) Nomogram of sarcoma patients. (D) Calibration curve for the nomogram.
Figure 5 — Predicting prognosis and immune status in sarcomas by identifying necroptosis-related lncRNAs | Aging