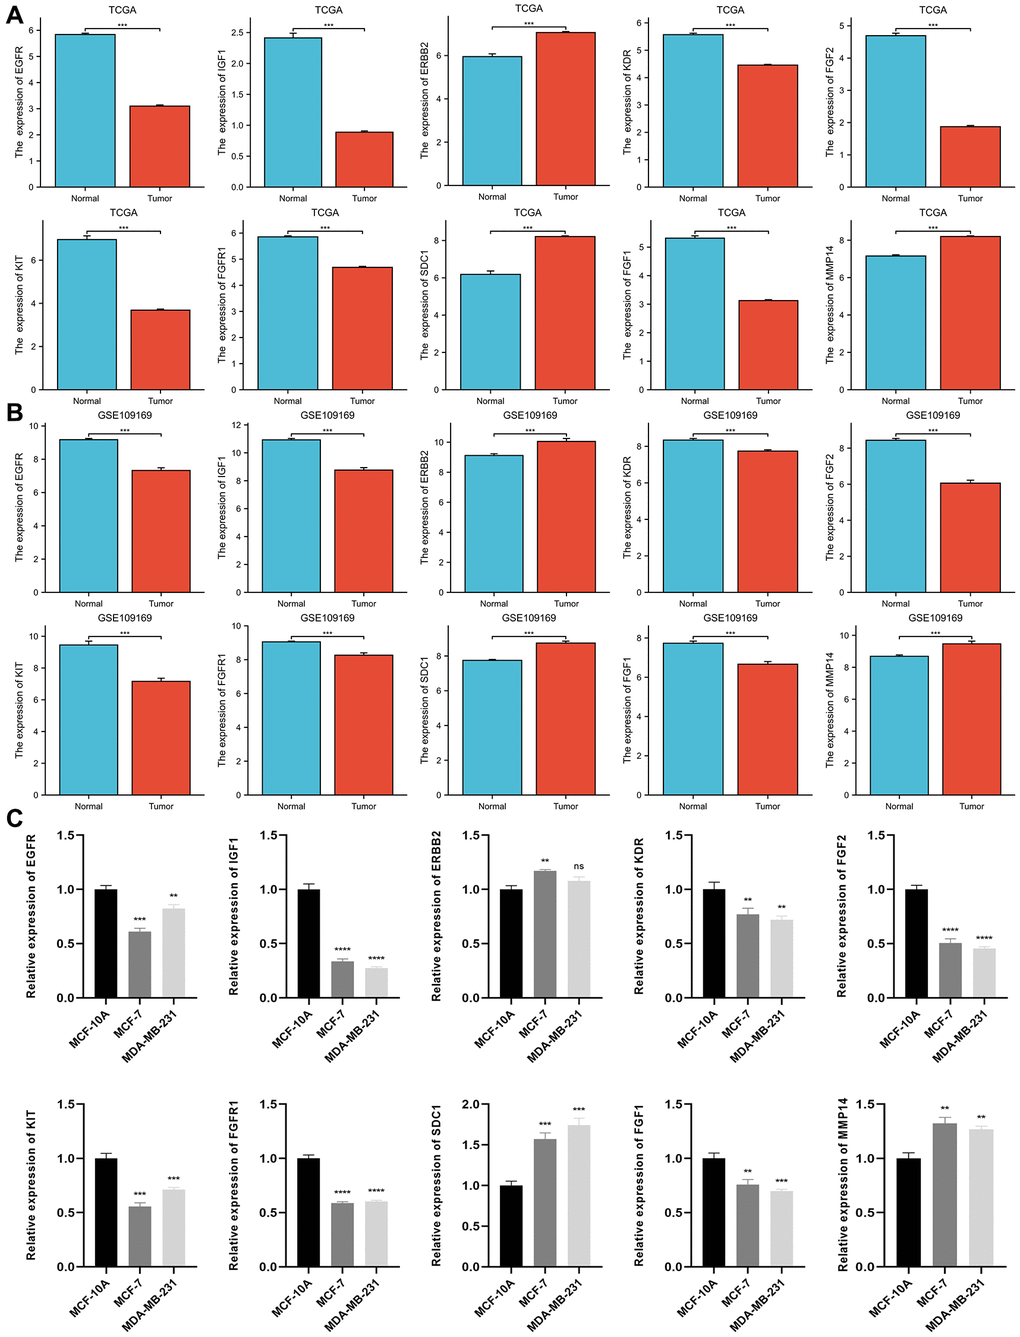
Figure 4.Differential expression of 10 ETGs in BC and normal adjacent tissues based on TCGA database (A) and validated by the GSE109169 dataset obtained from the GEO database (B) and cell lines (C).
Figure 4 — Clinical significance and immune characteristics analysis of miR-221-3p and its key target genes related to epithelial-mesenchymal transition in breast cancer | Aging