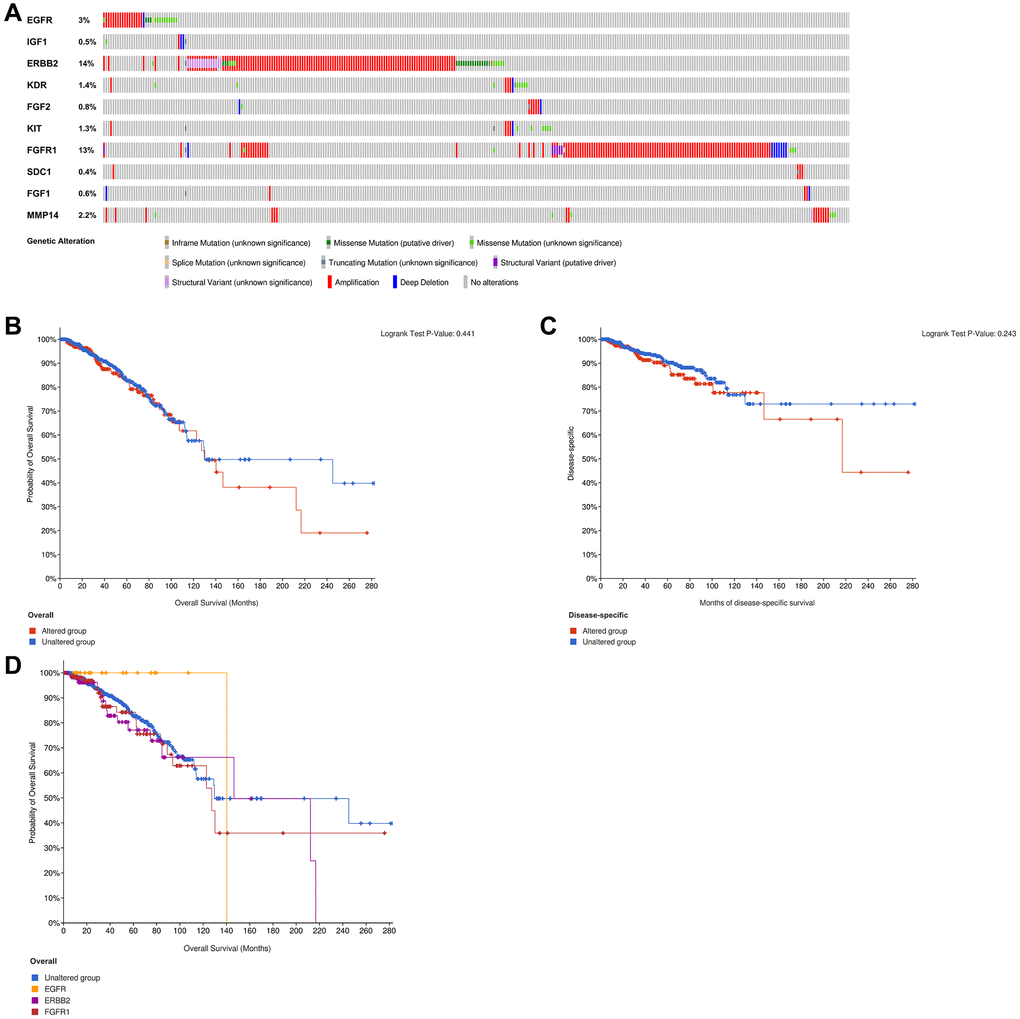
Figure 14.Analysis of genetic alteration of 10 ETGs (A). The KM survival curves show the OS and DSS between the ETGs altered group and the unaltered group (B, C). The KM survival curve shows the OS of the ETGs-unaltered group and the ETGs-altered groups of EGFR, ERBB2 and FGFR1 (D).