Submit an Article
Navigate
Home
Editorial Board
Editorial Policies
Current Volume
Archive
Scientific Integrity
Publication Ethics Statements
Interviews with Outstanding Authors
Newsroom
Sponsored Conferences
Podcast
Contact
Special Collections
Submit an Article
Online ISSN: 1945-4589
Research Paper
|
Volume 16, Issue 1
|
pp. 322–347
Clinical significance and immune characteristics analysis of miR-221-3p and its key target genes related to epithelial-mesenchymal transition in breast cancer
Back to article
Figure 10
(10 of 14)
−
100%
+
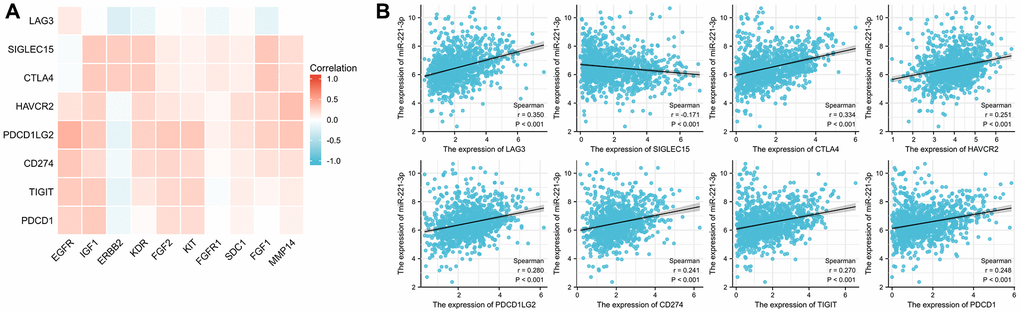
Figure 10.
Correlation between ICGs and ETGs expression (
A
), and correlation between ICGs and miR-221-3p expression (
B
).