Submit an Article
Navigate
Home
Editorial Board
Editorial Policies
Current Volume
Archive
Scientific Integrity
Publication Ethics Statements
Interviews with Outstanding Authors
Newsroom
Sponsored Conferences
Podcast
Contact
Special Collections
Submit an Article
Online ISSN: 1945-4589
Research Paper
|
Volume 16, Issue 1
|
pp. 285–298
MAGE-A11 is a potential prognostic biomarker and immunotherapeutic target in gastric cancer
Back to article
Figure 2
(2 of 12)
−
100%
+
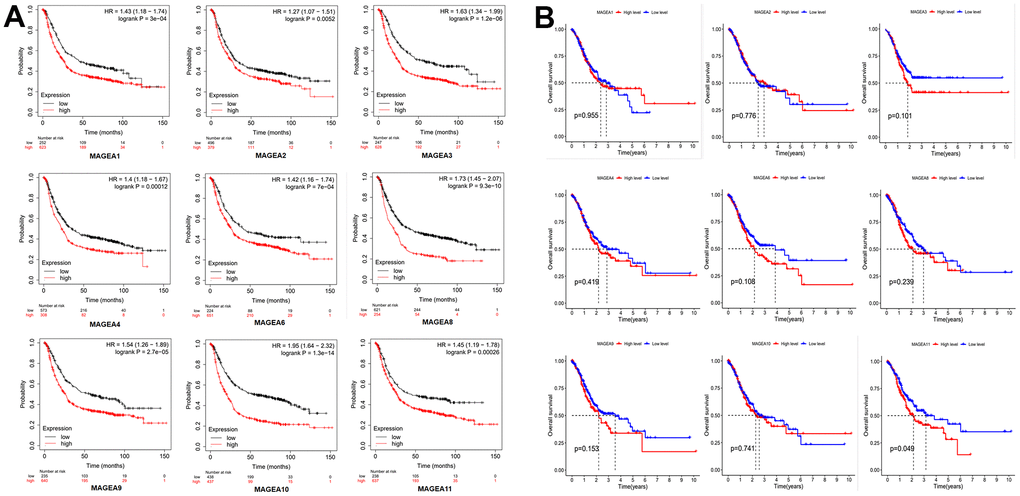
Figure 2.
Prognostic role of MAGE-A family members.
(
A
) Survival curve from the website Kaplan-Meier plotter. (
B
) Survival curves constructed by TCGA clinical and expression data.