Submit an Article
Navigate
Home
Editorial Board
Editorial Policies
Current Volume
Archive
Scientific Integrity
Publication Ethics Statements
Interviews with Outstanding Authors
Newsroom
Sponsored Conferences
Podcast
Contact
Special Collections
Submit an Article
Online ISSN: 1945-4589
Research Paper
|
Volume 16, Issue 1
|
pp. 207–225
Signatures of tumor-associated macrophages correlate with treatment response in ovarian cancer patients
Back to article
Figure 3
(3 of 9)
−
100%
+
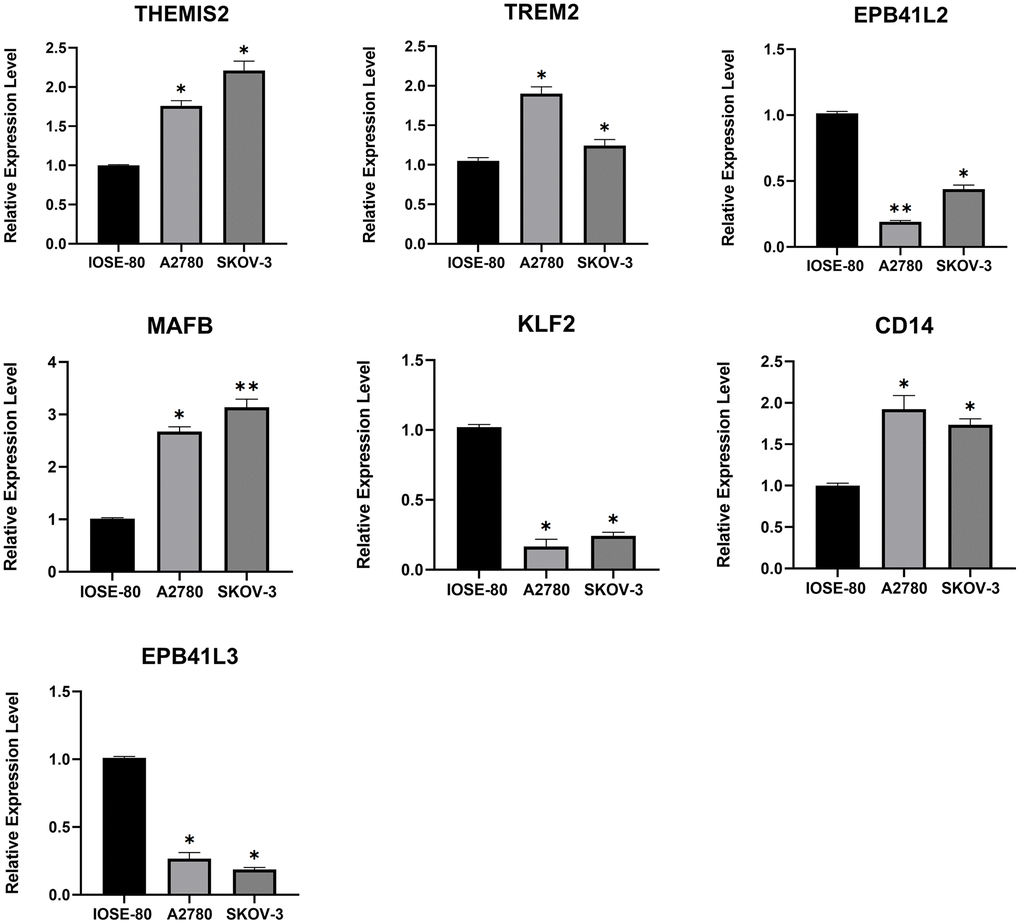
Figure 3.
The mRNA expression levels of 7 TMAGs.
Expression data were normalised to the reference genes (GAPDH), and are presented relative to the “calibrator” (IOSE-80).
*
P
< 0.05,
**
P
< 0.01, and
***
P
< 0.001.