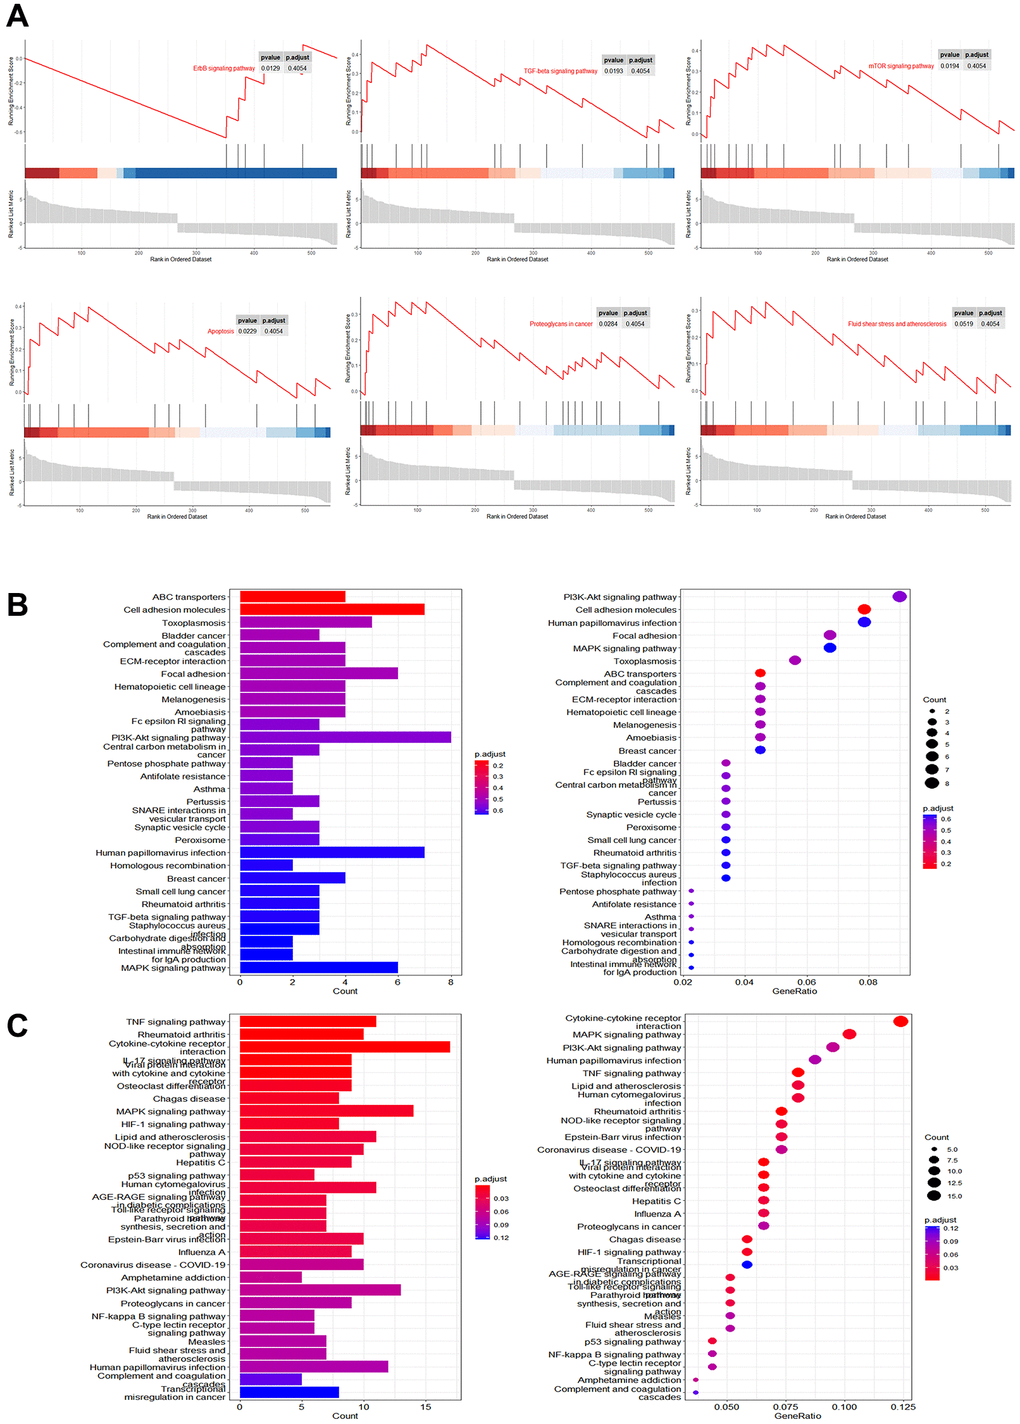
Figure 3.Pathway analysis of gene regulation by Mn2+ in macrophages. (A) GSEA of differentially expressed genes in Mn2+-treated group. (B) KEGG enrichment results of downregulated genes. (C) KEGG enrichment results of upregulated genes.
Figure 3 — Manganese and IL-12 treatment alters the ovarian tumor microenvironment | Aging