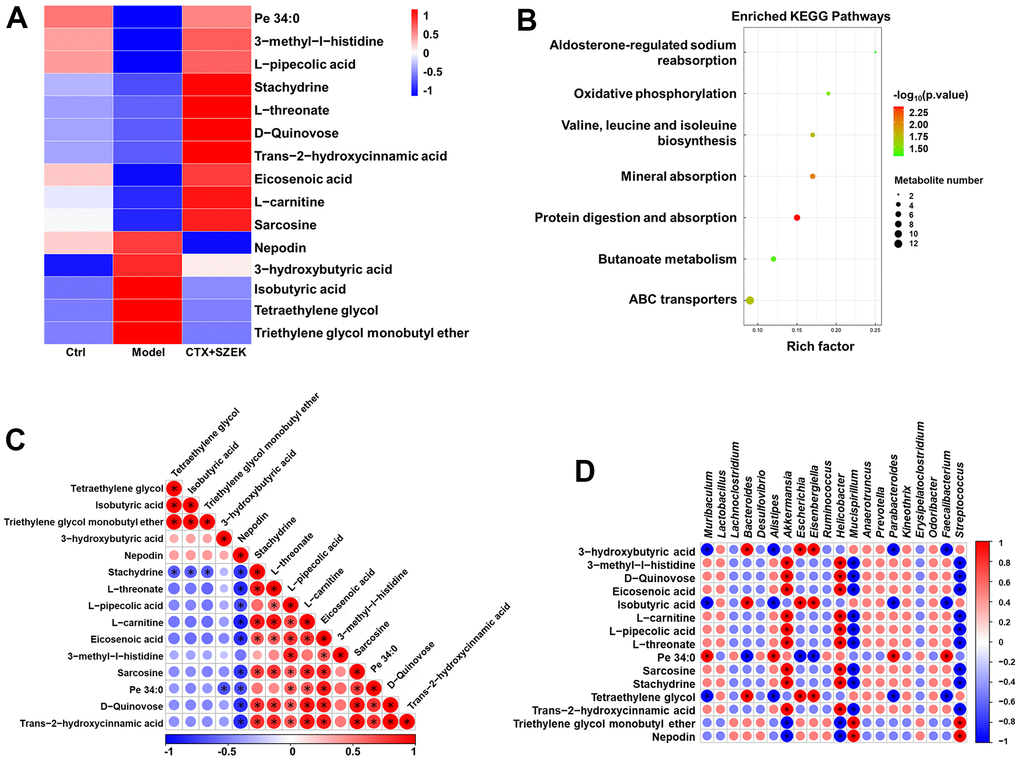
Figure 5.SZEK affects serum metabolite levels in mice with hematopoietic dysfunction (n=4). (A) Heat map analysis of differential metabolites. (B) KEGG pathways analysis of differential metabolites. (C) Correlative heat map analysis between differential metabolites. (D) Correlative heat map analysis between differential metabolites and intestinal flora. Ctrl, control; Model, hematopoietic dysfunction model.