Submit an Article
Navigate
Home
Editorial Board
Editorial Policies
Current Volume
Archive
Scientific Integrity
Publication Ethics Statements
Interviews with Outstanding Authors
Newsroom
Sponsored Conferences
Podcast
Contact
Special Collections
Submit an Article
Online ISSN: 1945-4589
Research Paper
|
Volume 16, Issue 1
|
pp. 129–152
Systematic analysis of the prognostic value and immunological function of LTBR in human cancer
Back to article
Figure 10
(10 of 12)
−
100%
+
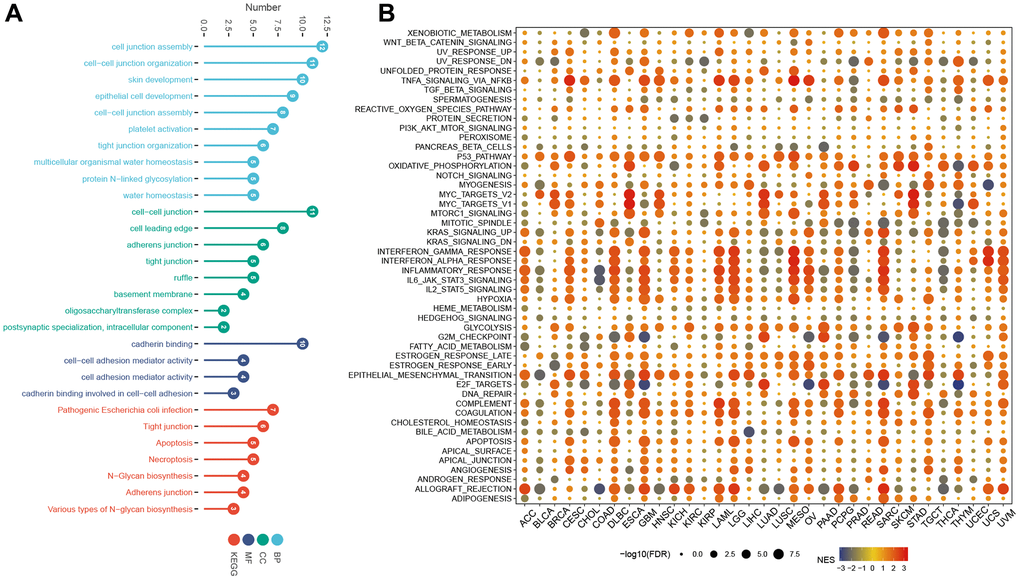
Figure 10.
GO, KEGG, and GSEA analysis.
(
A
) GO, and KEGG analysis. (
B
) GSEA of LTBR in the hallmarks gene set.