Submit an Article
Navigate
Home
Editorial Board
Editorial Policies
Current Volume
Archive
Scientific Integrity
Publication Ethics Statements
Interviews with Outstanding Authors
Newsroom
Sponsored Conferences
Podcast
Contact
Special Collections
Submit an Article
Online ISSN: 1945-4589
Research Paper
|
Volume 15, Issue 23
|
pp. 14445–14456
The effect of nutritional biochemical indexes on the hospitalization outcome of COVID-19
Back to article
Figure 5
(5 of 6)
−
100%
+
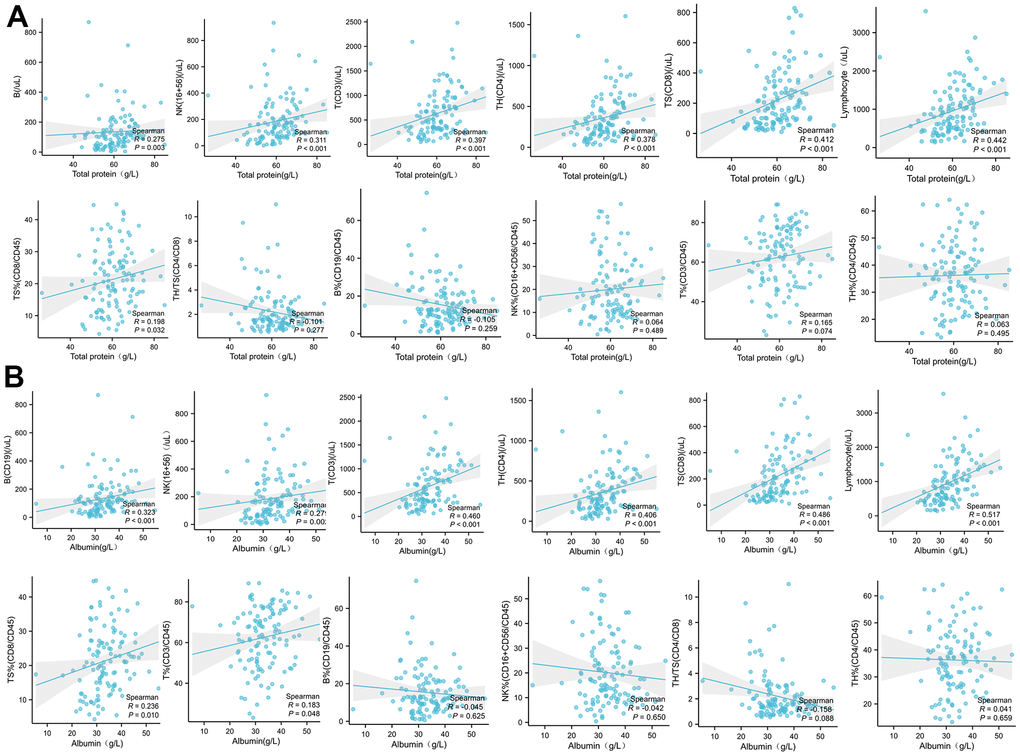
Figure 5.
The correlation analysis between the plasma total protein (
A
) or albumin (
B
) levels in COVID-19 patients with the absolute concentration or frequency (%) of B, NK, CD3, CD4, CD8, and total lymphocytes in PBMC.