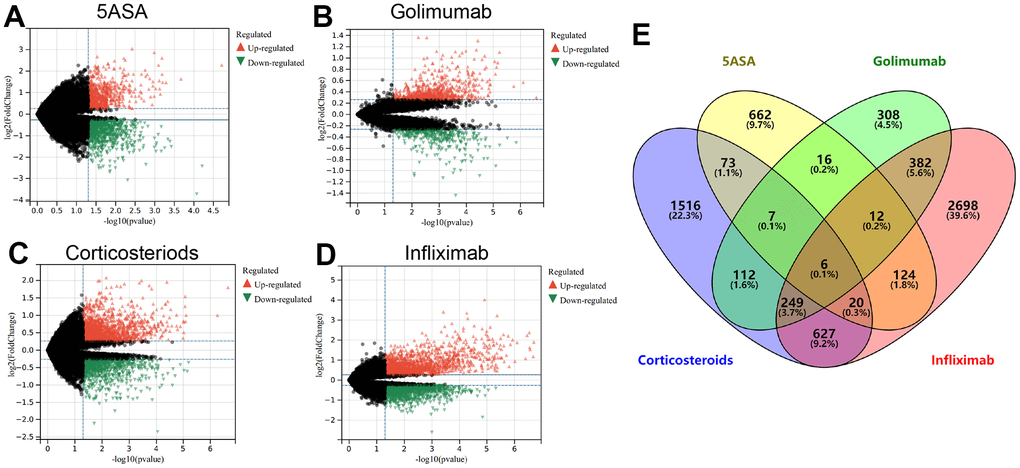
Figure 1.The volcano plot depicts the upregulated (in red) and downregulated (in green) genes observed in UC patients who remain unresponsive to treatment with 5-ASA (A), golimumab (B), corticosteroids (C), or infliximab (D). (E) The Venn diagram exhibits genes that are differentially expressed across all treatment modalities.