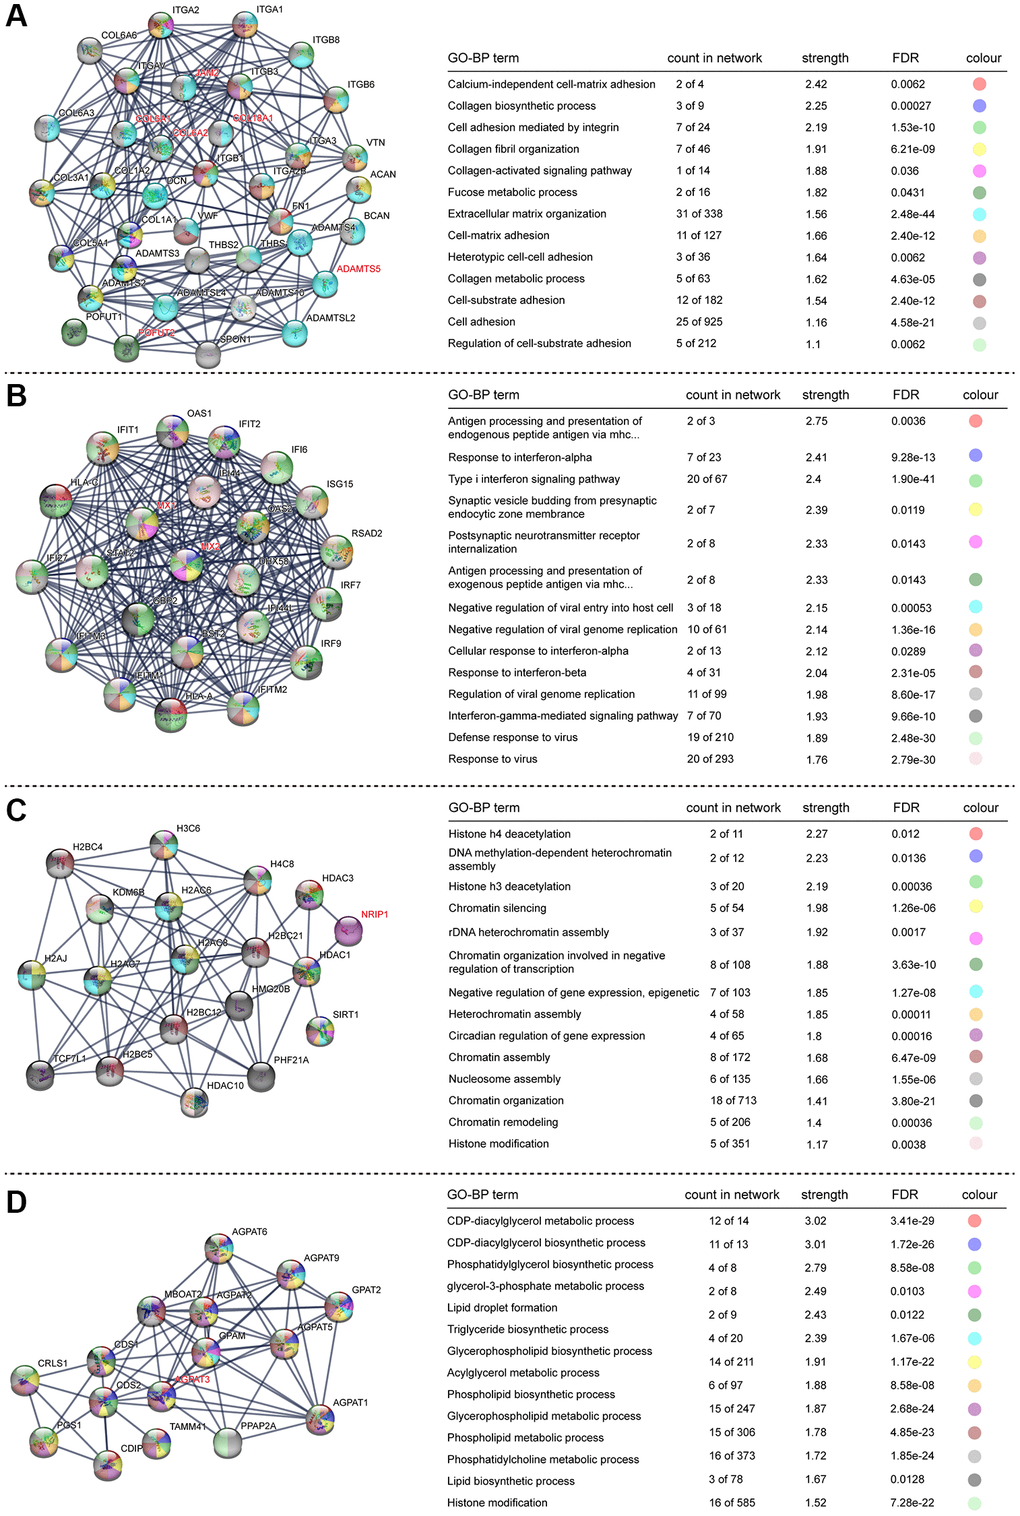
Figure 4.STRING protein network analysis of upregulated genes. (A–D) Different networks clustered in the upregulated genes. Dots indicate interacting proteins, and colours denote GO-BP terms enriched in each network. The HSA21-related genes are marked in red.