Submit an Article
Navigate
Home
Editorial Board
Editorial Policies
Current Volume
Archive
Scientific Integrity
Publication Ethics Statements
Interviews with Outstanding Authors
Newsroom
Sponsored Conferences
Podcast
Contact
Special Collections
Submit an Article
Online ISSN: 1945-4589
Research Paper
|
Volume 15, Issue 23
|
pp. 13998–14018
Modified Chaishao Liujunzi Decoction inhibits bile acid-induced gastric intestinal metaplasia: from network prediction to experimental verification
Back to article
Figure 2
(2 of 11)
−
100%
+
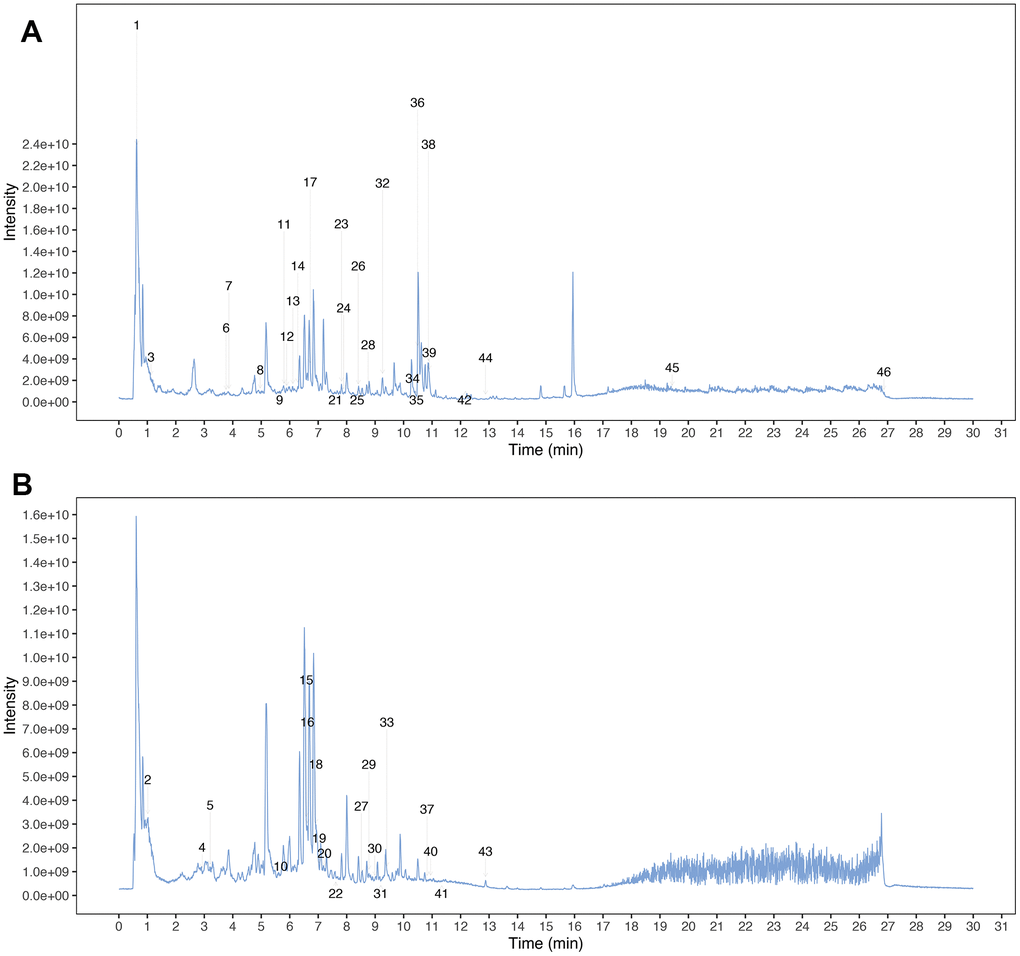
Figure 2.
Mass spectrum chromatograms of MCLD.
(
A
) Positive total ion chromatogram of MCLD; (
B
) Negative total ion chromatogram of MCLD.