Submit an Article
Navigate
Home
Editorial Board
Editorial Policies
Current Volume
Archive
Scientific Integrity
Publication Ethics Statements
Interviews with Outstanding Authors
Newsroom
Sponsored Conferences
Podcast
Contact
Special Collections
Submit an Article
Online ISSN: 1945-4589
Research Paper
|
Volume 15, Issue 23
|
pp. 13901–13919
Crosstalk of cuproptosis-related prognostic signature and competing endogenous RNAs regulation in hepatocellular carcinoma
Back to article
Figure 2
(2 of 8)
−
100%
+
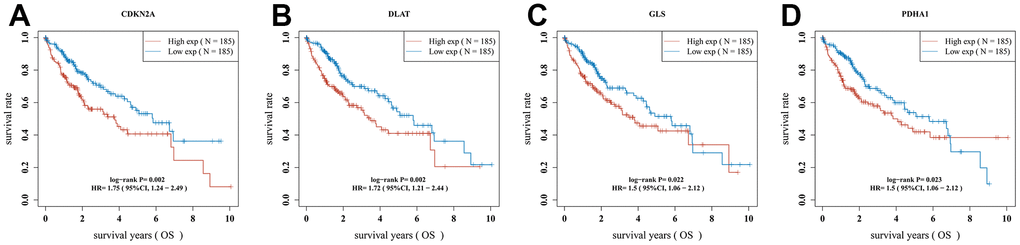
Figure 2.
The overall survival curve of CRGs in HCC patients in the high-/low-expression group.
(
A
) CDKN2A (
B
) DLAT (
C
) GLS (
D
) PDHA1.