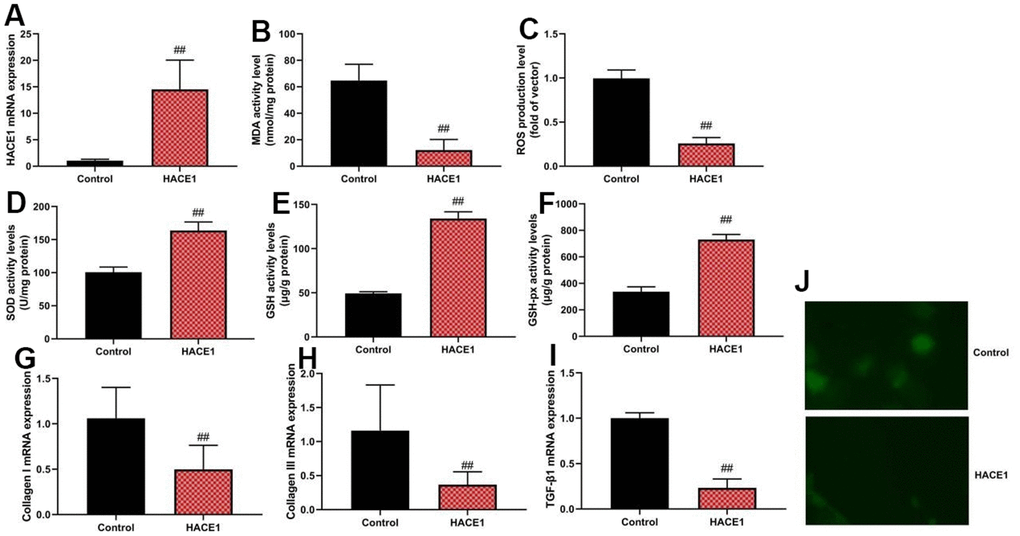
Figure 2.HACE1 reduced oxidative stress in vitro model. HACE1 mRNA expression (A), MDA, ROS, SOD, GSH and GSH-px levels (B–F), collagen I, collagen III and TGF-β mRNA expression (G–I). ##p<0.01 compared with control group. Immunofluorescence images of HACE1 (J).