Submit an Article
Navigate
Home
Editorial Board
Editorial Policies
Current Volume
Archive
Scientific Integrity
Publication Ethics Statements
Interviews with Outstanding Authors
Newsroom
Sponsored Conferences
Podcast
Contact
Special Collections
Submit an Article
Online ISSN: 1945-4589
Research Paper
|
Volume 15, Issue 23
|
pp. 13822–13839
Identification and validation of feature genes associated with M1 macrophages in preeclampsia
Back to article
Figure 4
(4 of 8)
−
100%
+
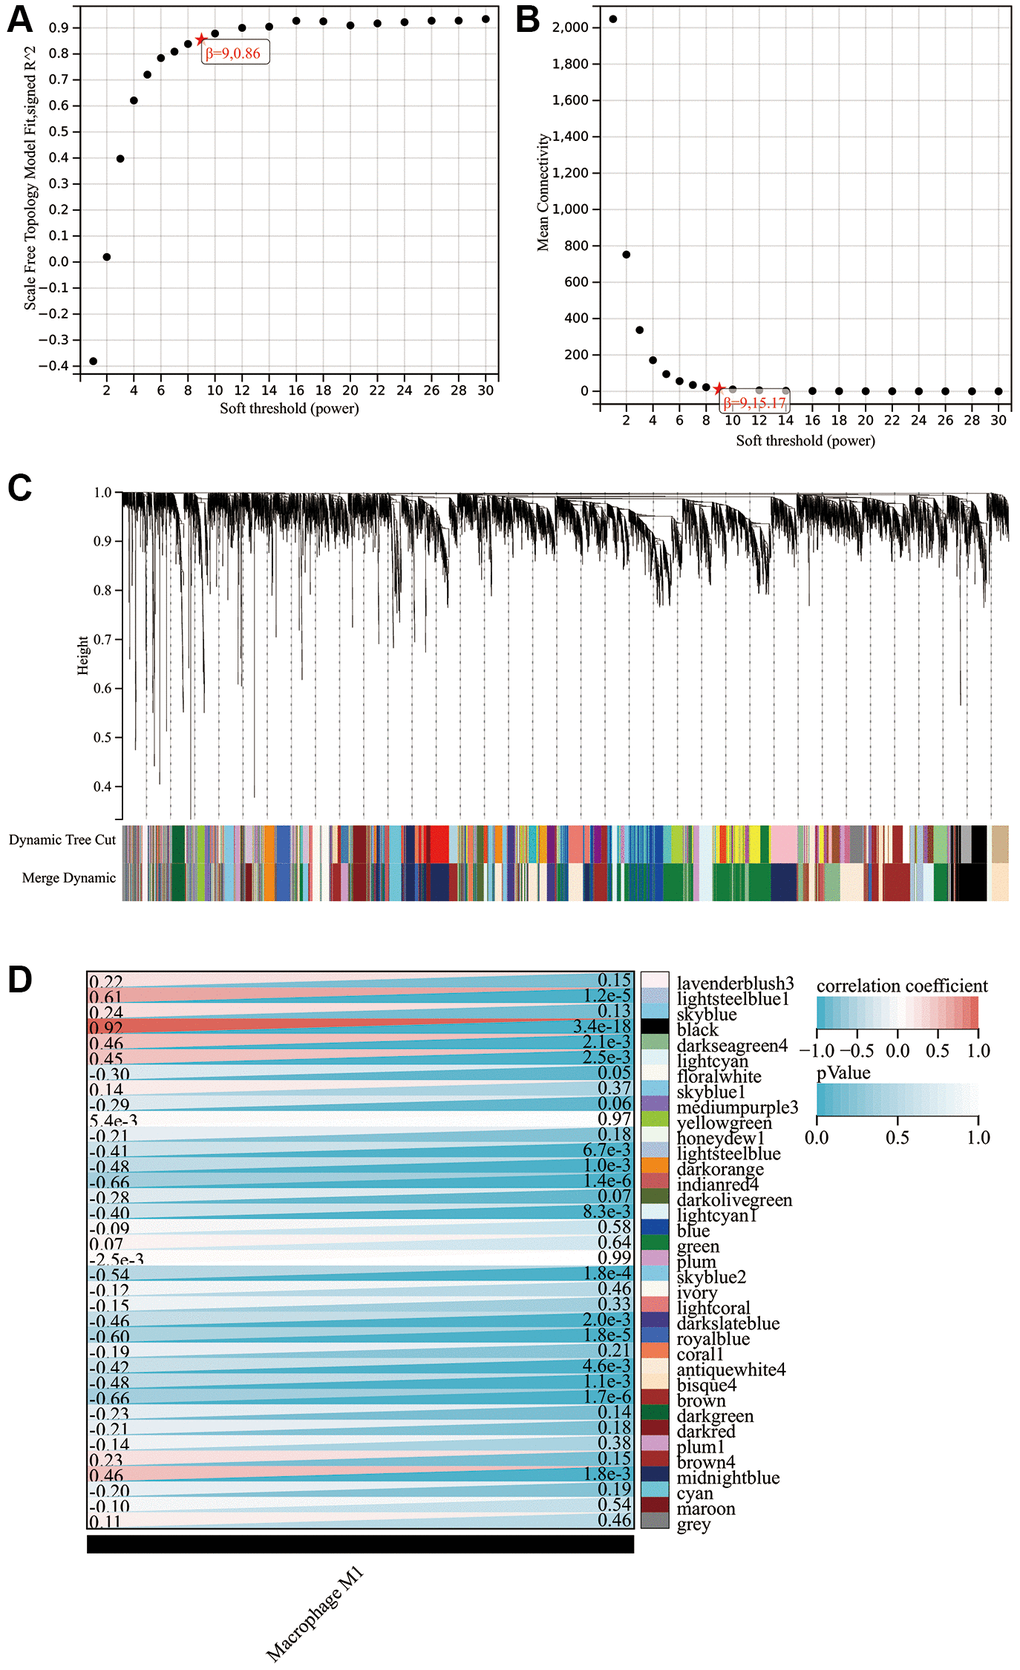
Figure 4.
WGCNA findings.
(
A
) Scale independence plot. (
B
) Mean connectivity plot. (
C
) Gene clustering dendrogram. (
D
) Heat map showing the correlation between modules and M1 macrophages.