Submit an Article
Navigate
Home
Editorial Board
Editorial Policies
Current Volume
Archive
Scientific Integrity
Publication Ethics Statements
Interviews with Outstanding Authors
Newsroom
Sponsored Conferences
Podcast
Contact
Special Collections
Submit an Article
Online ISSN: 1945-4589
Research Paper
|
Volume 15, Issue 23
|
pp. 13776–13798
Prognostic role of long non-coding RNA USP30-AS1 in ovarian cancer: insights into immune cell infiltration in the tumor microenvironment
Back to article
Figure 10
(10 of 10)
−
100%
+
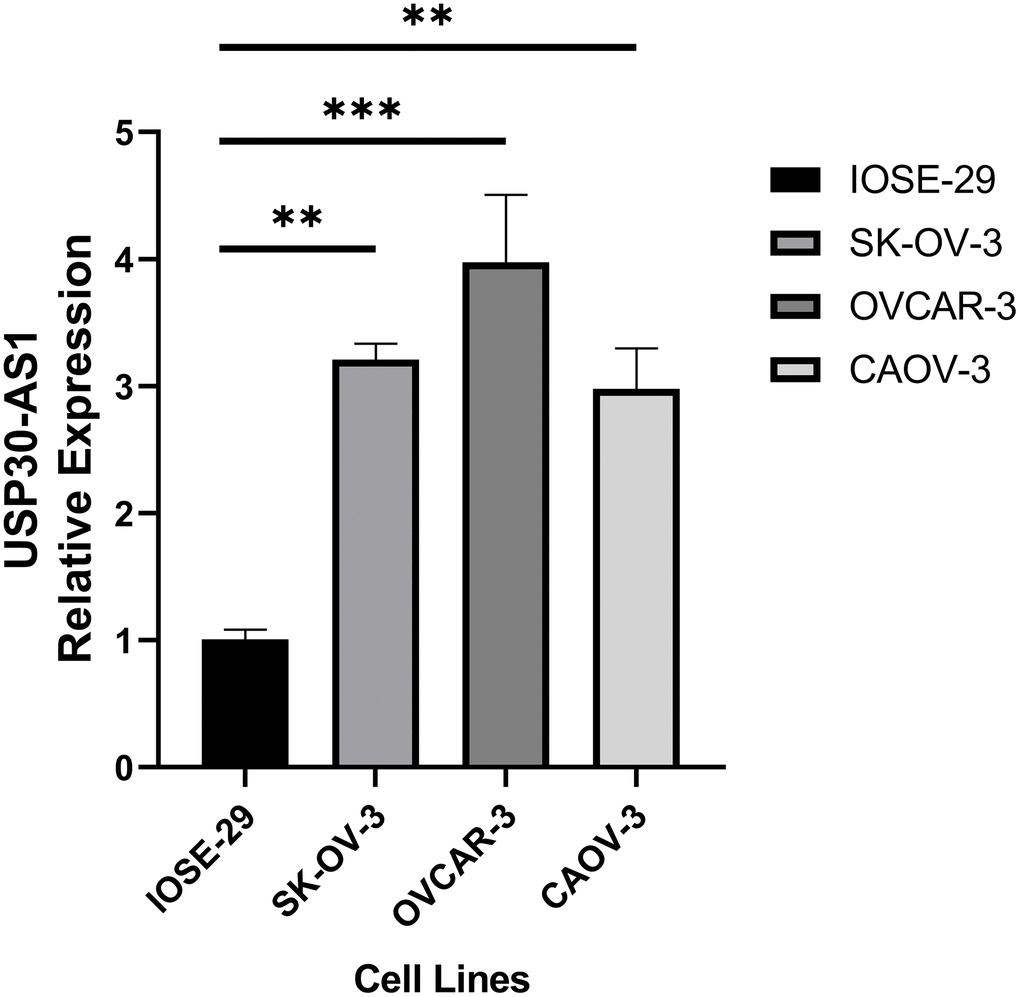
Figure 10.
RT-qPCR analysis of ovarian cancer cell line and normal ovarian cell line.