Submit an Article
Navigate
Home
Editorial Board
Editorial Policies
Current Volume
Archive
Scientific Integrity
Publication Ethics Statements
Interviews with Outstanding Authors
Newsroom
Sponsored Conferences
Podcast
Contact
Special Collections
Submit an Article
Online ISSN: 1945-4589
Research Paper
|
Volume 15, Issue 22
|
pp. 13434–13451
Predicting the prognosis in patients with sepsis by an endoplasmic reticulum stress gene signature
Back to article
Figure 2
(2 of 8)
−
100%
+
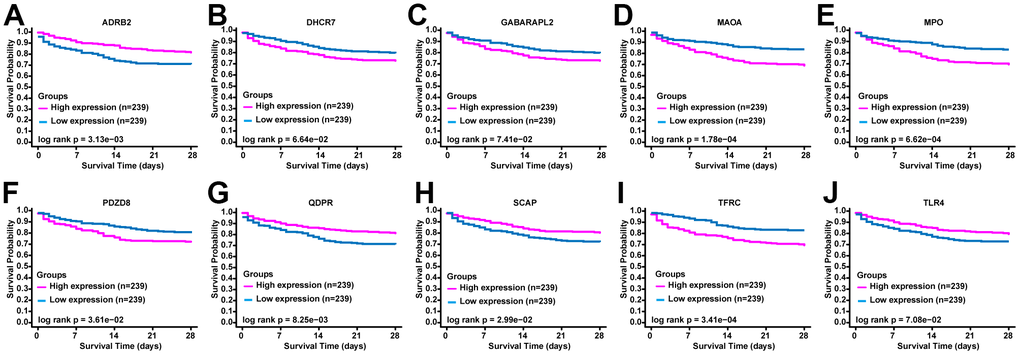
Figure 2.
The prognostic value of ERGs expression in sepsis.
KM survival curves of (
A
) ADRB2, (
B
) DHCR7, (
C
) GABARAPL2, (
D
) MAOA, (
E
) MPO, (
F
) PDZD8, (
G
) QDPR, (
H
) SCAP, (
I
) TFRC, and (
J
) TLR4.