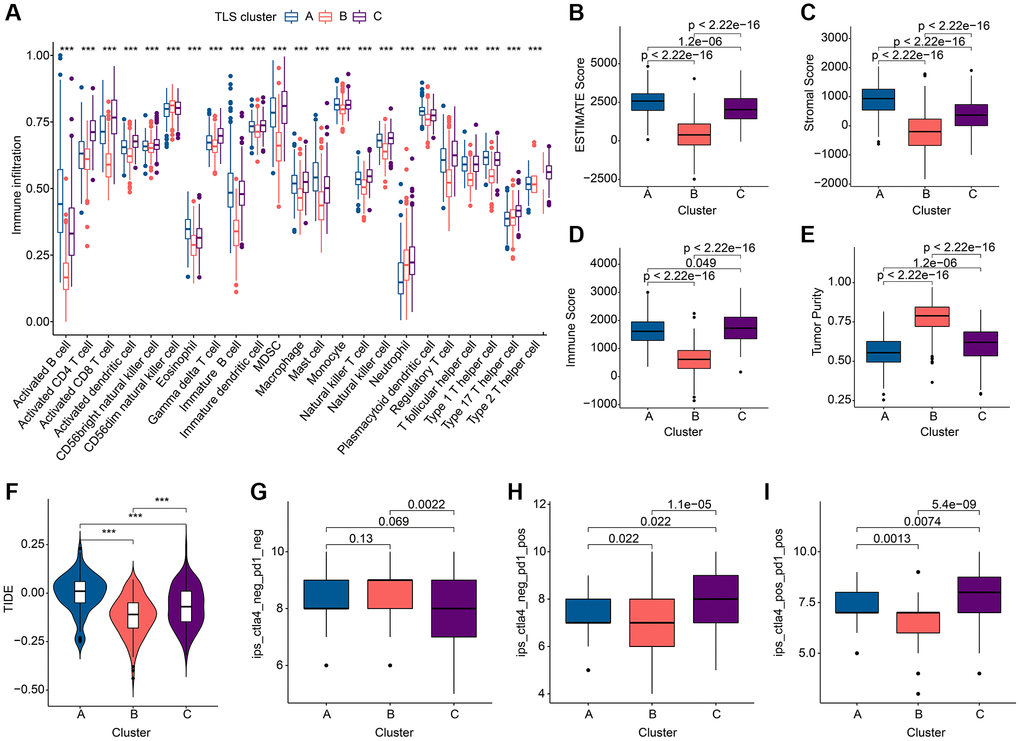
Figure 3.Immune landscape analysis results of TLS subgroups in GC. (A) Results of 23 immune cell abundance analyses by ssGSEA. (B–E) ESTIMATE algorithm results. (F) TIDE score results. (G–I). Results of immunotherapy analysis. *p < 0.05; **p < 0.01; ***p < 0.001.