Submit an Article
Navigate
Home
Editorial Board
Editorial Policies
Current Volume
Archive
Scientific Integrity
Publication Ethics Statements
Interviews with Outstanding Authors
Newsroom
Sponsored Conferences
Podcast
Contact
Special Collections
Submit an Article
Online ISSN: 1945-4589
Research Paper
|
Volume 15, Issue 22
|
pp. 13287–13311
Molecular characteristics and clinical implications of serine/arginine-rich splicing factors in human cancer
Back to article
Figure 7
(7 of 7)
−
100%
+
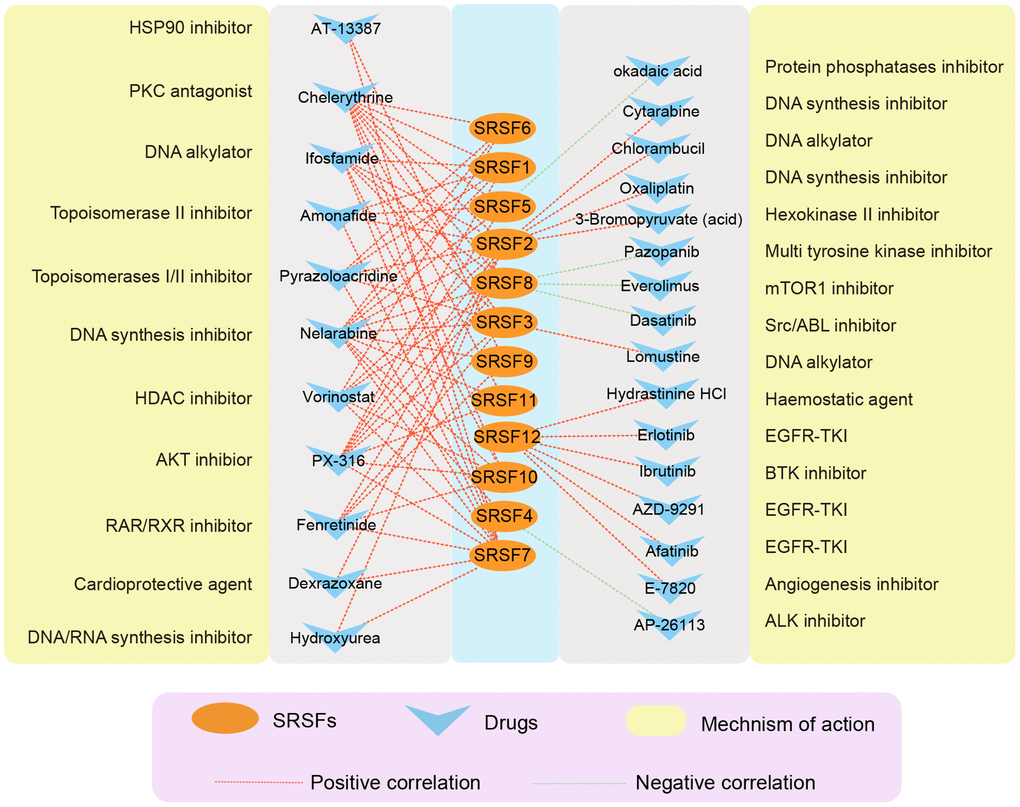
Figure 7.
The correlation network showing the association of SRSFs to drug sensitivity.
Red represents a positive correlation, and green represents a negative correlation.