Submit an Article
Navigate
Home
Editorial Board
Editorial Policies
Current Volume
Archive
Scientific Integrity
Publication Ethics Statements
Interviews with Outstanding Authors
Newsroom
Sponsored Conferences
Podcast
Contact
Special Collections
Submit an Article
Online ISSN: 1945-4589
Research Paper
|
Volume 15, Issue 22
|
pp. 13150–13162
SEL1L3 as a link molecular between renal cell carcinoma and atherosclerosis based on bioinformatics analysis and experimental verification
Back to article
Figure 5
(5 of 10)
−
100%
+
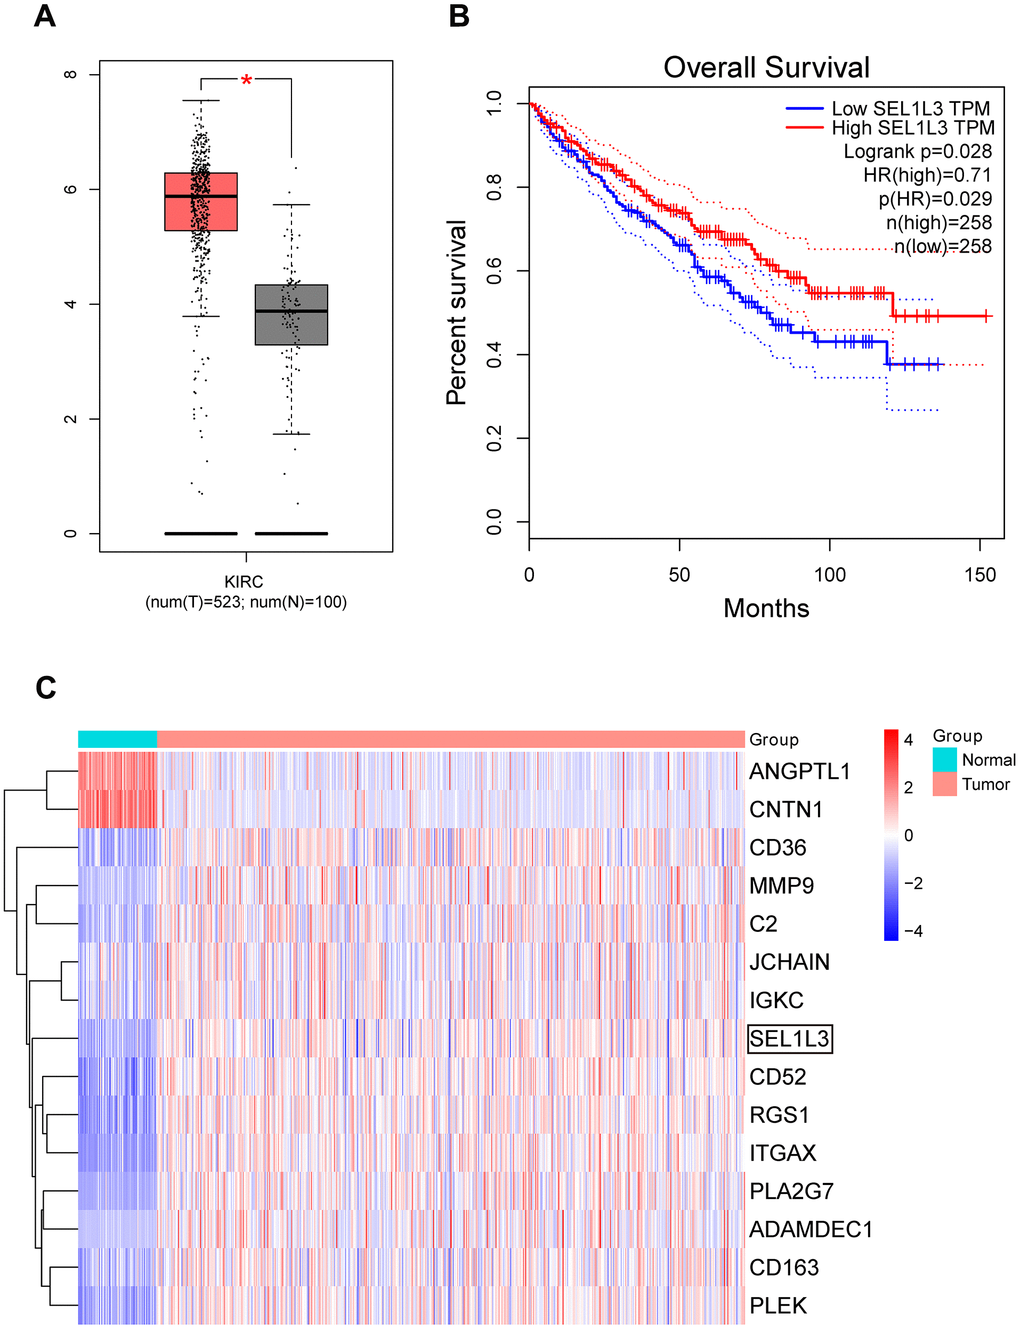
Figure 5.
(
A
) Expression box plot of SEL1L3 in TCGA KIRC dataset. (
B
) Survival curve of SEL1L3 in KIRC dataset. (
C
) Heatmap of DEGs.