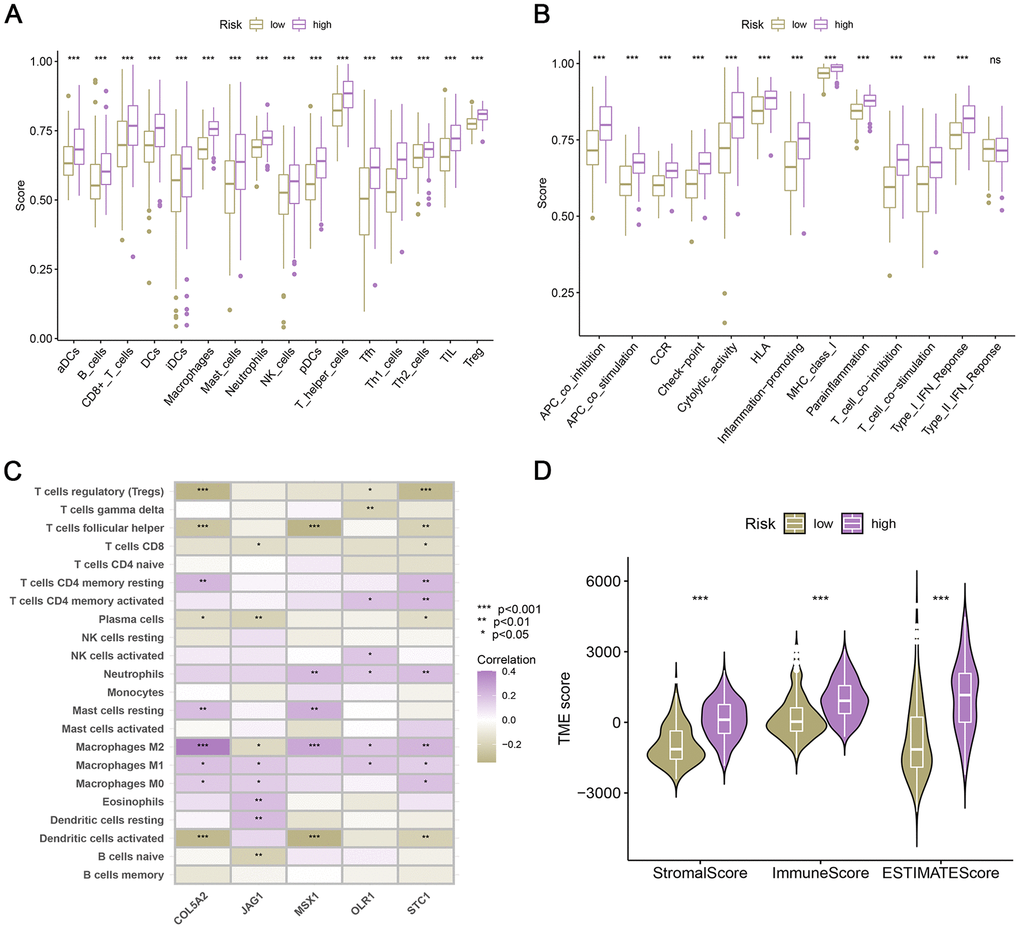
Figure 3.Relationship between risk score and human immunity. (A) The ratio of TIICs in two risk groups. (B) Immune-related function in two risk groups. (C) Correlation between the 5 ARGs of the model and immune infiltrating cells. (D) Differences of TME scores in low- and high-risk patients.