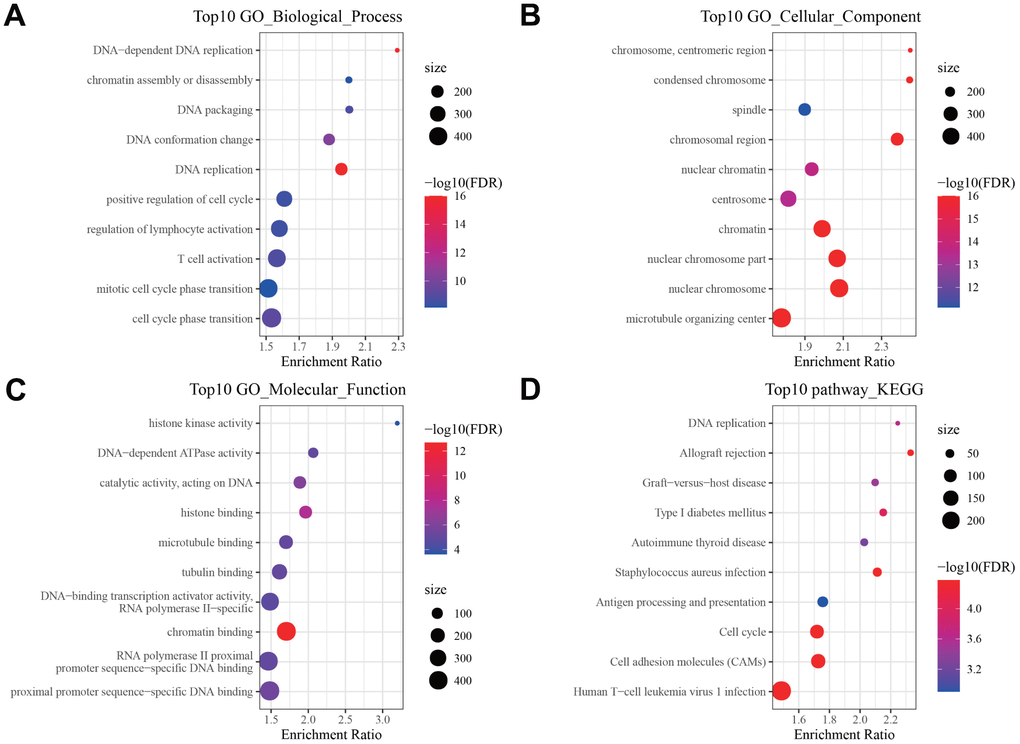
Figure 4.Pathway enrichment analysis of DEGs. Bubble diagram showing the top 10 enriched (A) Biological Processes, (B) Cellular Components, (C) Molecular Functions in GO annotation, and (D) KEGG pathways enriched by DEGs.
Figure 4 — Identification of aneuploidy-related gene signature to predict survival in head and neck squamous cell carcinomas | Aging