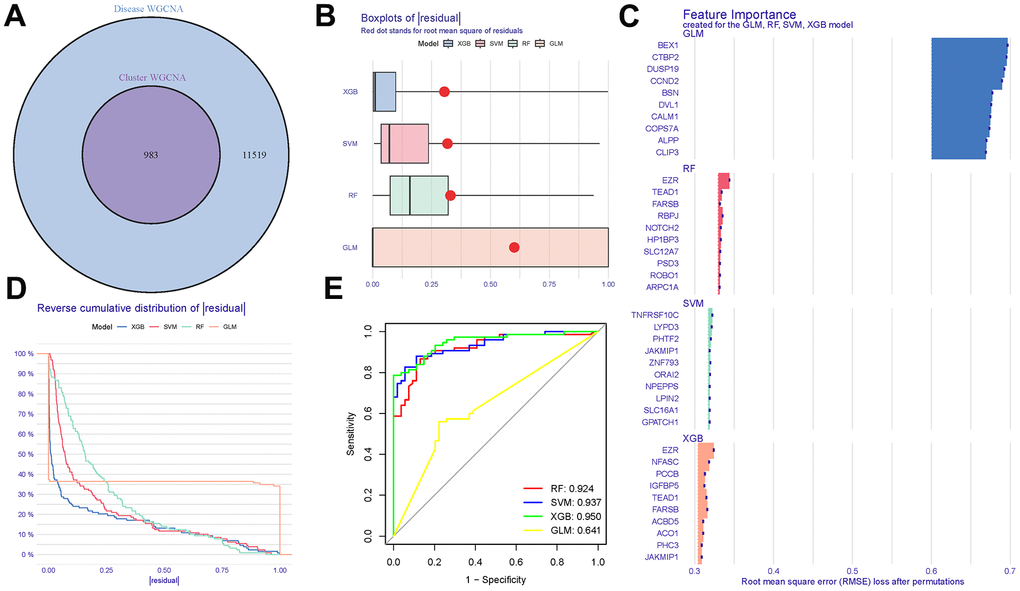
Figure 7.Cluster construction of co-expression modules. (A) Identification of tryptophan metabolism-related genes with a Venn diagram. (B, C) Residual expression patterns. (D) Model trend chart. (E) AUC of train group.
Figure 7 — Identification of tryptophan metabolism-related genes in immunity and immunotherapy in Alzheimer’s disease | Aging