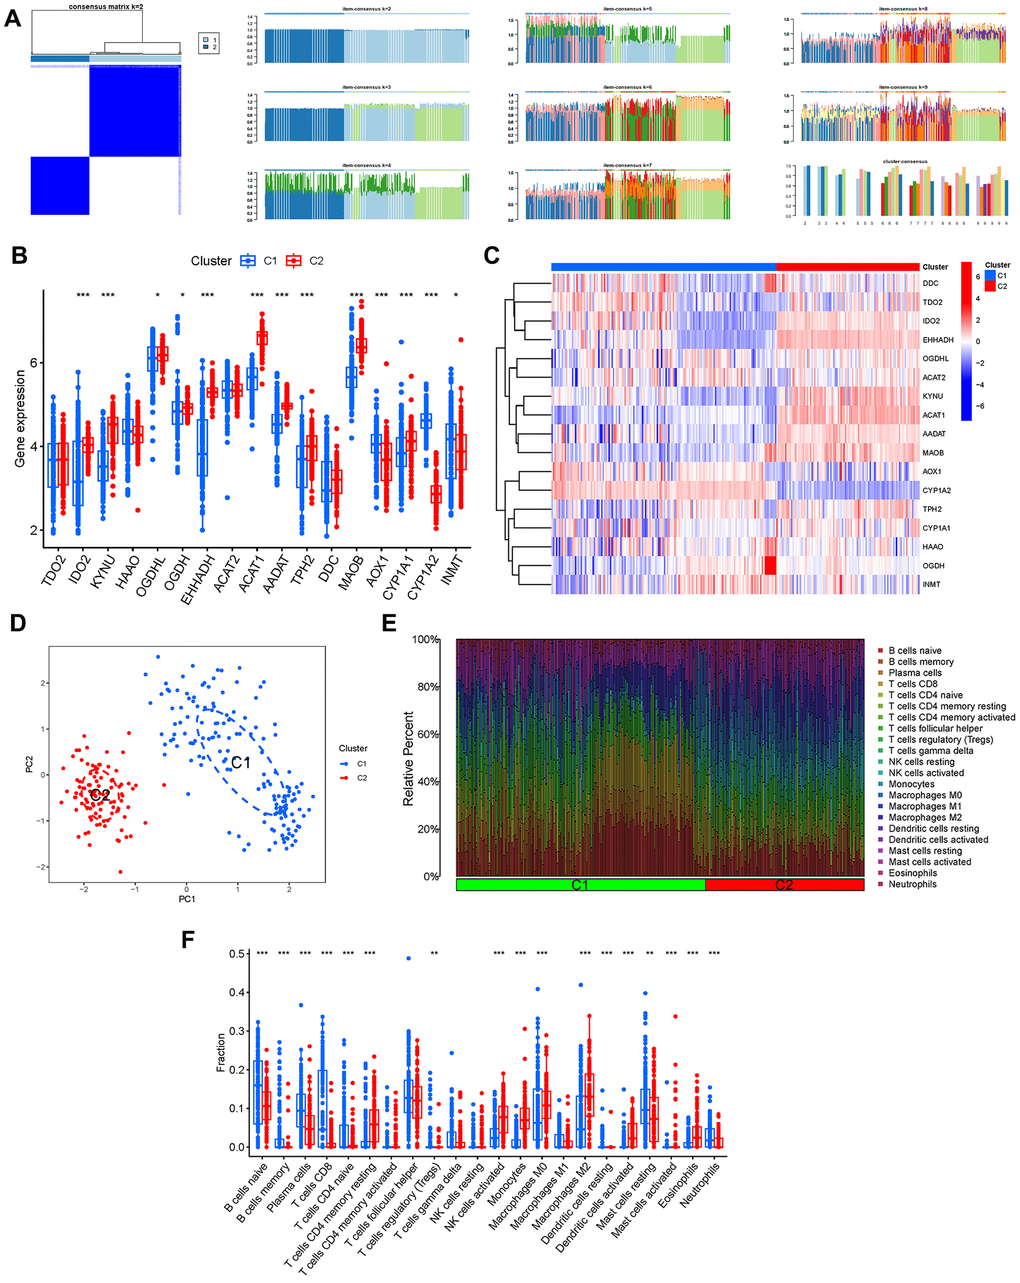
Figure 5.Cluster analysis. (A) Consensus clustering matrix. (B, C) Expression of the TrpMgs in different clusters. (D) PCA. (E, F) Immune cell infiltration of different clusters.
Figure 5 — Identification of tryptophan metabolism-related genes in immunity and immunotherapy in Alzheimer’s disease | Aging