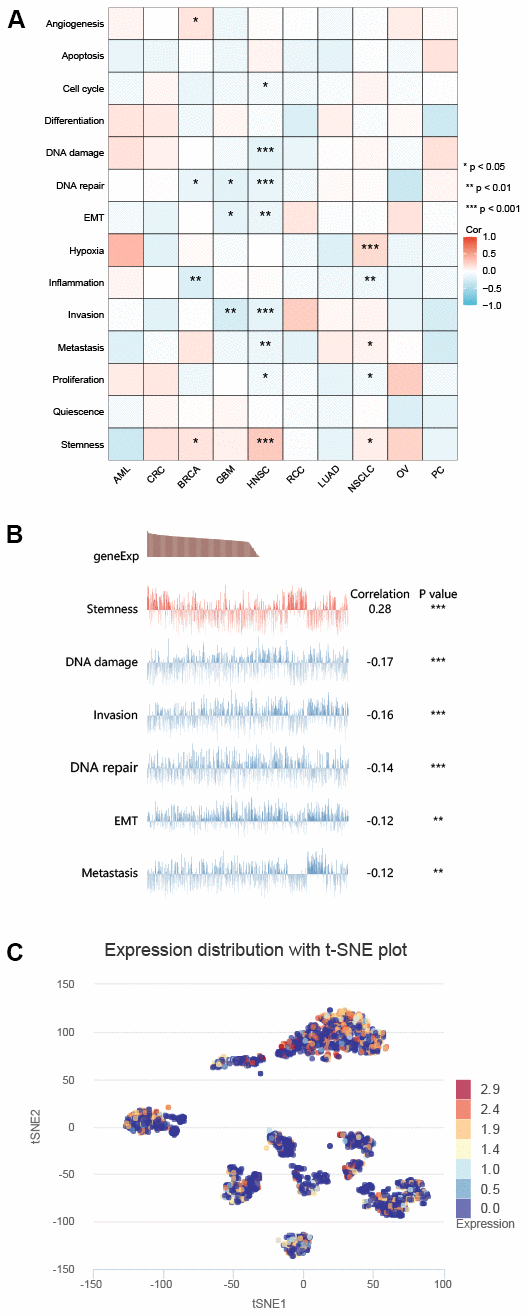
Figure 11.CancerSEA showed that the expression of ZNF692 in single cell sequencing was associated with tumor functional status. (A) The expression of ZNF692 was associated with different tumors. (B) The expression of ZNF692 in GBM was associated with different functional states. (C) ZNF692 expression in GBM single cells (T-SNE). * indicates p < 0.05. ** represents p < 0.01. *** p < 0.001.