Submit an Article
Navigate
Home
Editorial Board
Editorial Policies
Current Volume
Archive
Scientific Integrity
Publication Ethics Statements
Interviews with Outstanding Authors
Newsroom
Sponsored Conferences
Podcast
Contact
Special Collections
Submit an Article
Online ISSN: 1945-4589
Research Paper
|
Volume 15, Issue 22
|
pp. 12907–12926
The necroptosis signature and molecular mechanism of lung squamous cell carcinoma
Back to article
Figure 3
(3 of 12)
−
100%
+
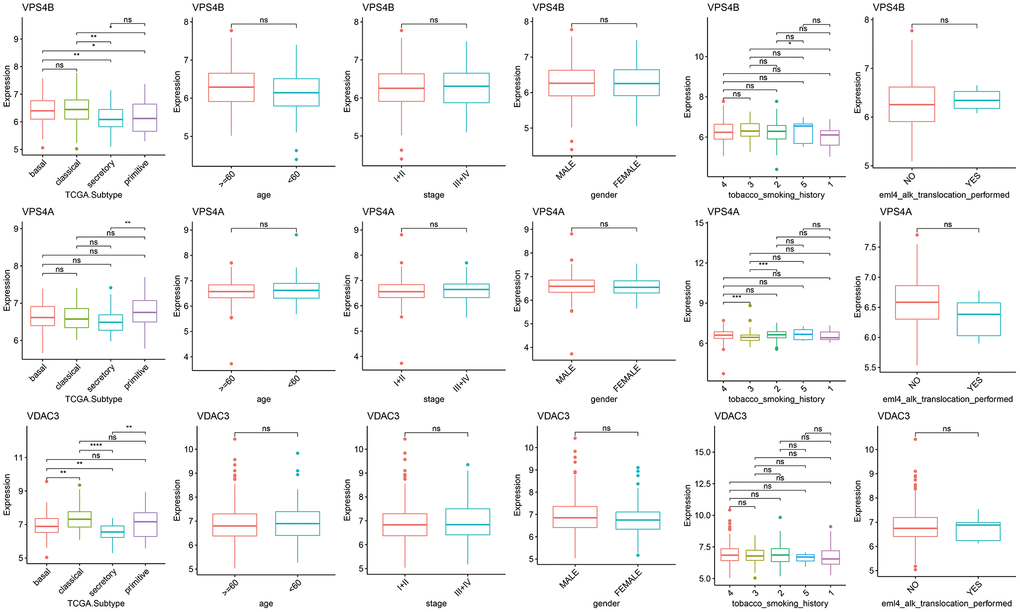
Figure 3.
Differences in the expression of necroptosis genes among the clinical subgroups.
(
*
p
< 0.05;
**
p
< 0.01;
***
p
< 0.001;
****
p
< 0.0001; ns
p
> 0.05).