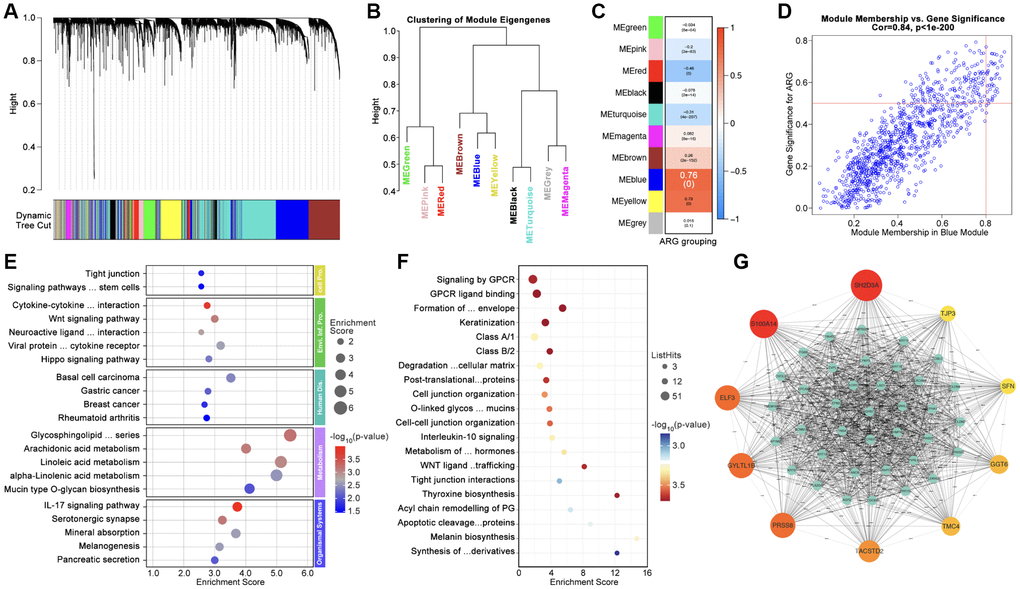
Figure 4.Identification of Hubgenes amongst ARG subgroups. (A, B) Dynamic tree cut and modules stratification of WCGNA. (C) Correlation between modules and ARG grouping. (D) The correlation between Module-blue and ARG grouping. (E) GO analysis and (F) KEGG analysis. (G) Interaction network of top 50 Hubgenes.