Submit an Article
Navigate
Home
Editorial Board
Editorial Policies
Current Volume
Archive
Scientific Integrity
Publication Ethics Statements
Interviews with Outstanding Authors
Newsroom
Sponsored Conferences
Podcast
Contact
Special Collections
Submit an Article
Online ISSN: 1945-4589
Research Paper
|
Volume 15, Issue 21
|
pp. 12674–12697
Integrated analysis of single-cell RNA-seq and bulk RNA-seq unravels the heterogeneity of cancer-associated fibroblasts in TNBC
Back to article
Figure 7
(7 of 10)
−
100%
+
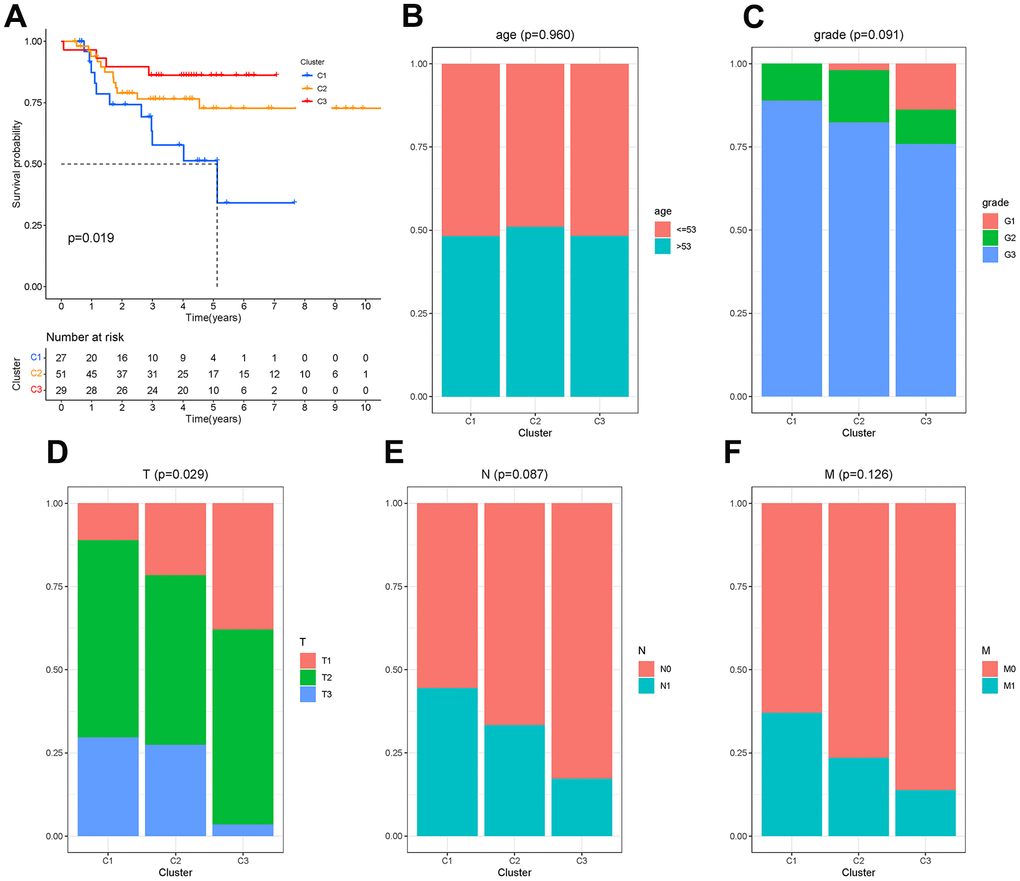
Figure 7.
Molecular clusters of TNBC.
(
A
) Kaplan-Meier analysis among molecular clusters. (
B
–
F
) Distribution of clinical characteristics in clusters.