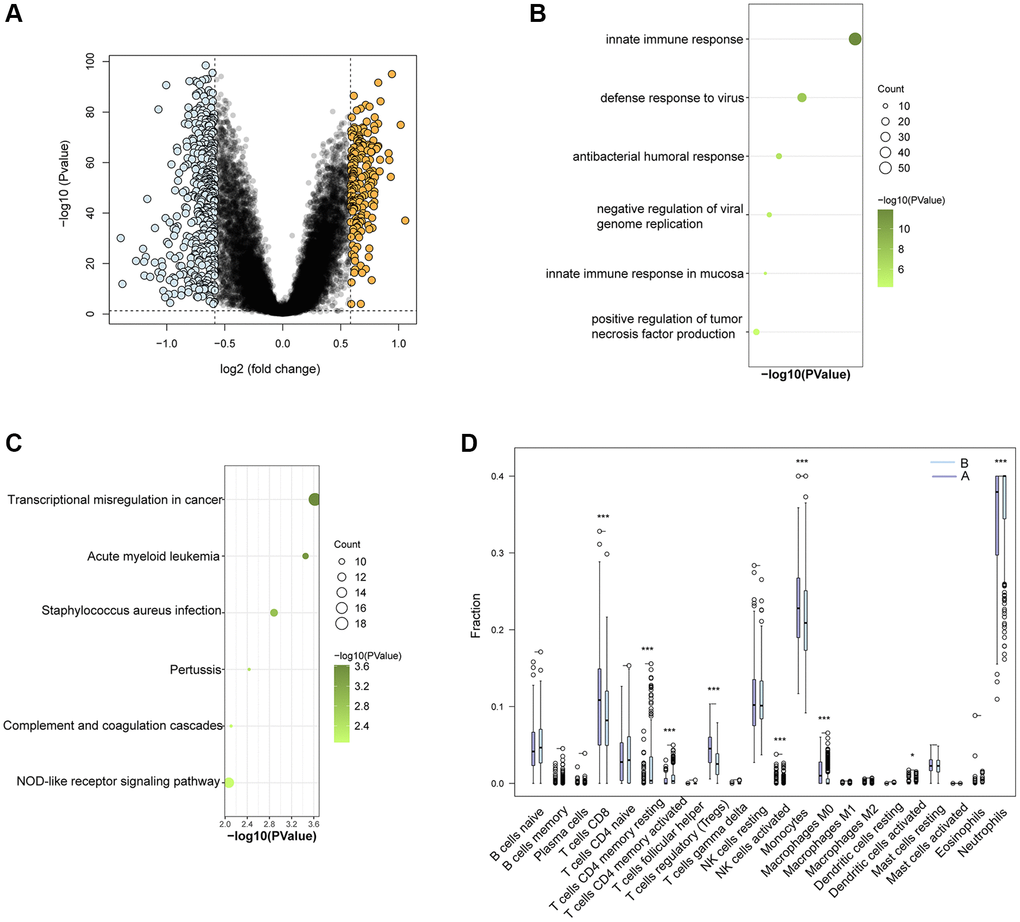
Figure 8.Functional and immune cell enrichment analysis between Ub-related subcluster. (A) The volcano plotting of DEGs. (B) Enrichment items in GO BP and (C) KEGG pathway analysis. (D) The proportion of all 22 types of immune cells. *p < 0.05; ***p < 0.001.