Submit an Article
Navigate
Home
Editorial Board
Editorial Policies
Current Volume
Archive
Scientific Integrity
Publication Ethics Statements
Interviews with Outstanding Authors
Newsroom
Sponsored Conferences
Podcast
Contact
Special Collections
Submit an Article
Online ISSN: 1945-4589
Research Paper
|
Volume 15, Issue 23
|
pp. 13655–13668
Down-regulation of EZH2 genes targeting RUNX3 affects proliferation, invasion, and metastasis of human colon cancer cells by Wnt/β-catenin signaling pathway
Back to article
Figure 4
(4 of 10)
−
100%
+
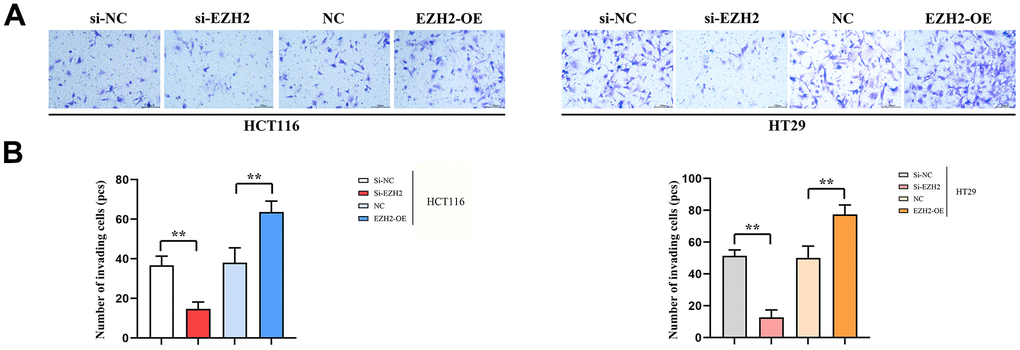
Figure 4.
Number of transmembrane cells (100PX).
(
A
) Invasion results plot of HT29 cells and HCT116 cells; (
B
) HT29 cell and HCT116 cell invasion statistics. (**
P
< 0.01 *
P
< 0.05; N=3/Group).