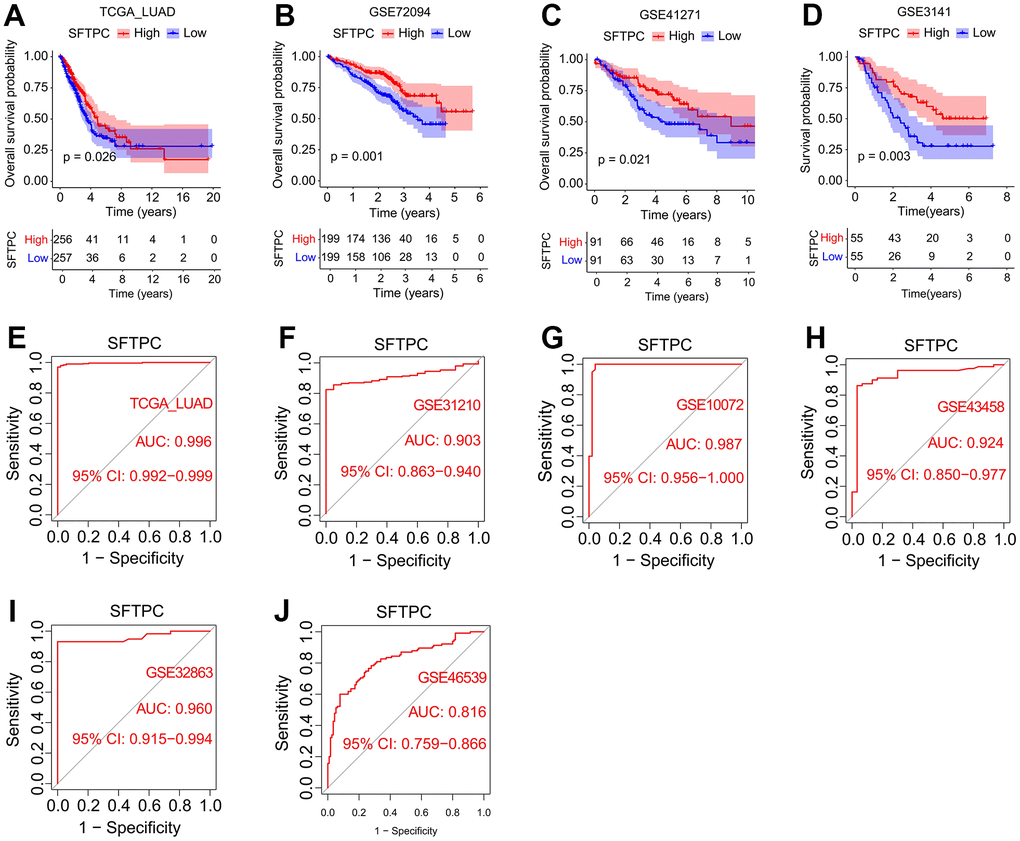
Figure 2.Correlation analysis between SFTPC and the incidence and prognosis of lung adenocarcinoma. (A–D) Kaplan-Meier curves of the OS of LUAD patients in the TCGA_LUAD, GSE72094, GSE41271, and GSE3141 cohorts. (E–J) SFTPC-dependent ROC analyses of the pathogenic status in TCGA_LUAD (E), GSE31210 (F), GSE10072 (G), GSE43458 (H), GSE32863 (I), and GSE46539 cohorts.