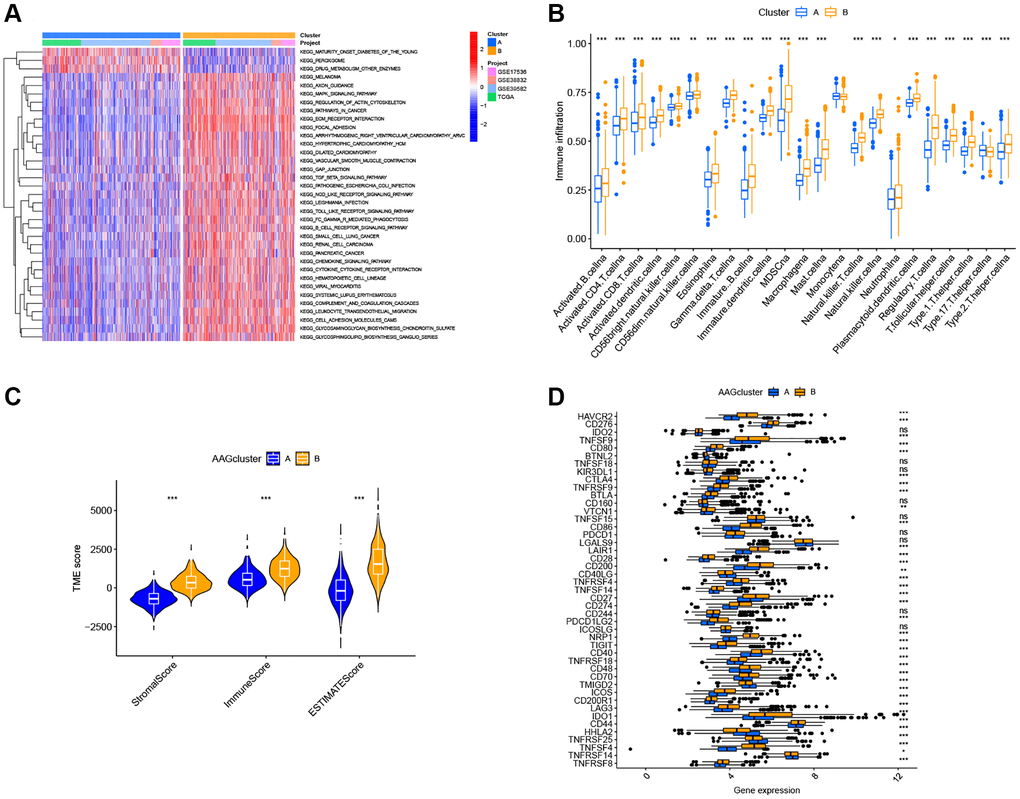
Figure 3.Two ARG subtypes showed diverse tumor immune cell microenvironments. (A) Biological processes analyzed by GSVA showing the active biological pathways in distinct subtypes. (B) The abundance of 23 TME infiltrating cells between the two subtypes of ARGs. (C) Correlations between the two ARG subgroups and the TME score. (D) Expression levels of 47 immune checkpoints in the two subtypes. *P < 0.05; **P < 0.01; ***P < 0.001.