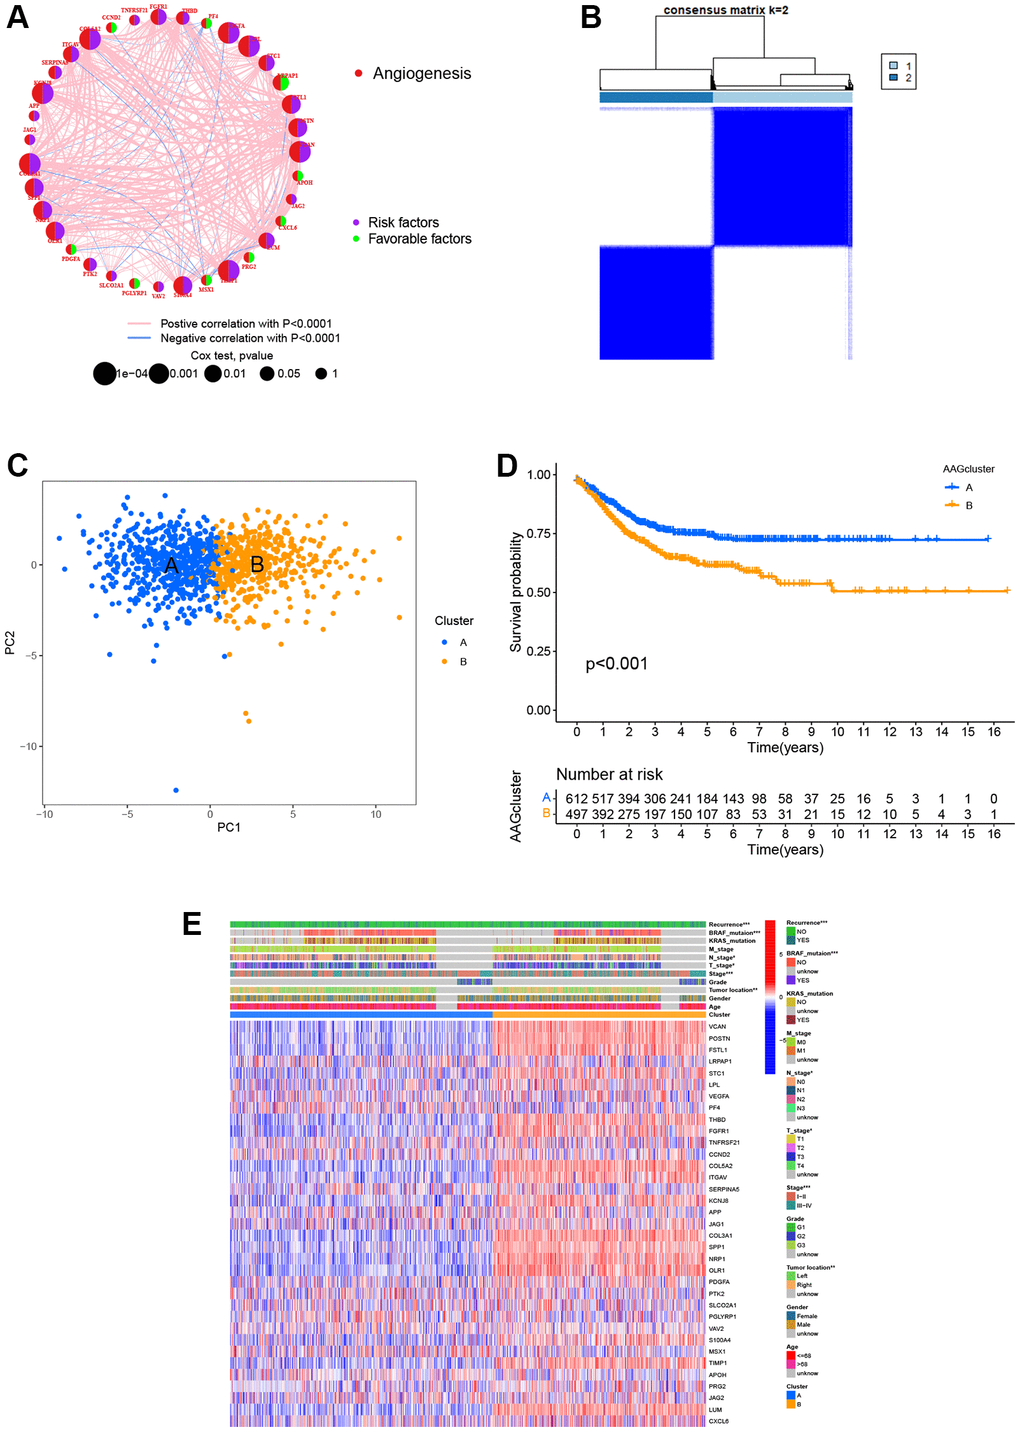
Figure 2.ARG-related subtypes and clinicopathological and biological characteristics of two distinct subgroups of samples divided by consistent clustering. (A) The correlation network of ARGs in CRC (red line: positive correlation; blue line: negative correlation). (B) Consensus matrix heatmap defining two clusters (k = 2) and their correlation area. (C) PCA showing a remarkable difference in transcriptomes between the two subtypes. (D) Univariate analysis showing 36 ARGs related to the RFS time. (E) Differences in clinicopathological and biological characteristics of the two distinct subtypes. *P < 0.05; **P < 0.01; ***P < 0.001.