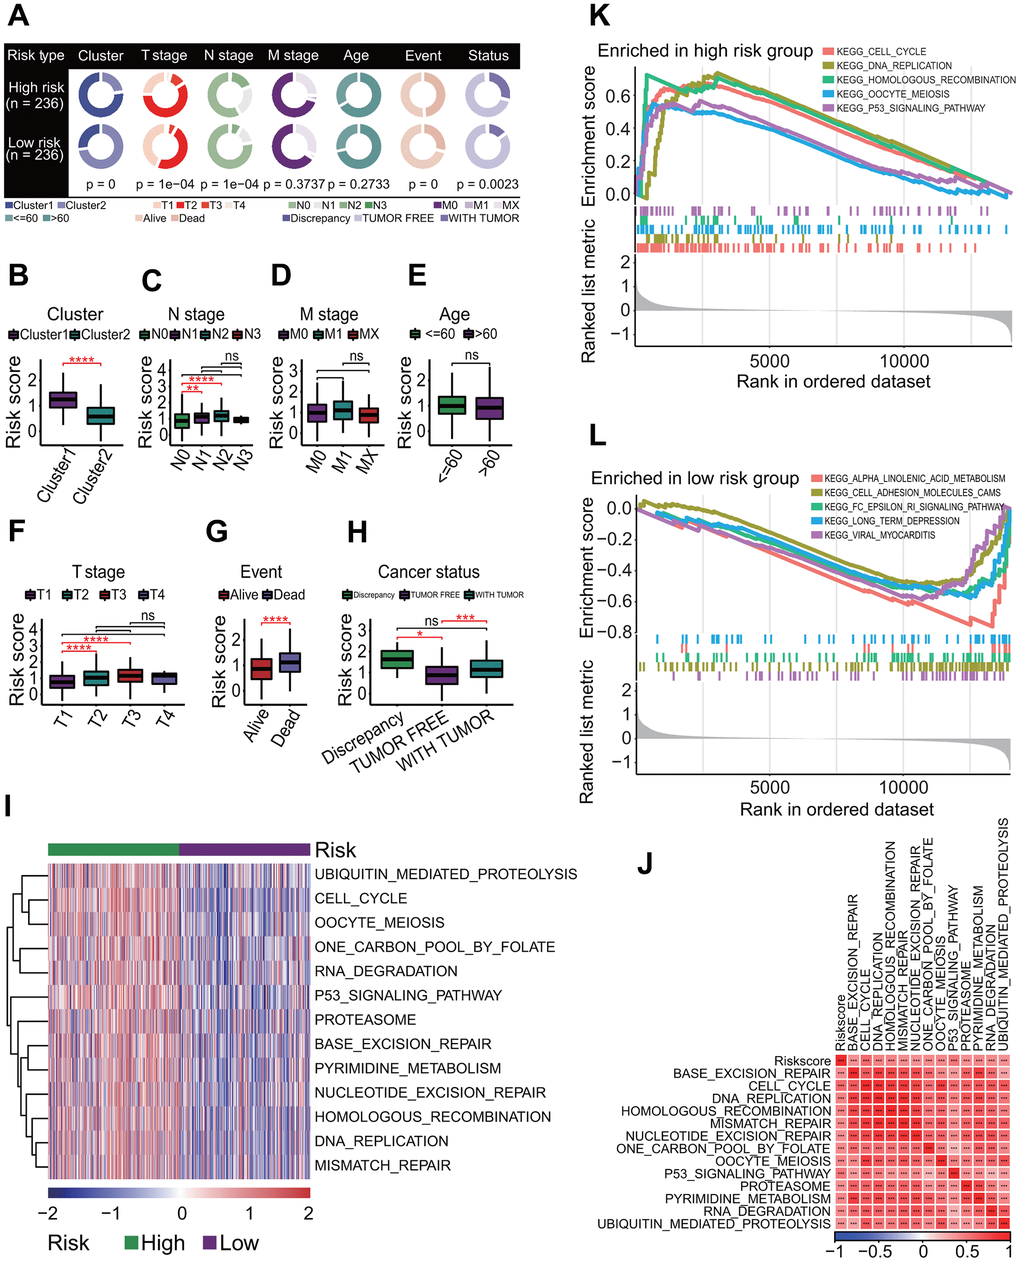
Figure 12.Correlations of risk score with clinical characteristics and biological pathways. (A) Correlations of risk score with clinical characteristics. Risk score was significantly correlated with prognostic cluster (p = 0), T staging (p = 1e-04), N staging (p = 1e-04), survival status (p = 0) and cancer status (p = 0.0023). (B) Comparisons of risk scores for patients between two clusters. Risk score in the cluster 1 was significantly higher than that in the cluster 2. ****p < 0.0001. (C) Comparisons of risk scores for patients between four N stages. Risk scores of patients with stage N0 were significantly lower than those with stage N1 and those with stage N2. **p < 0.01 and ***p < 0.001. (D) Comparisons of risk scores for patients between three M stages. The risk scores had no significant differences between three M stages. (E) Comparison of risk scores for patients between <= 60 and > 60 age subgroups. The risk scores had no significant differences between two age subgroups. (F) Comparisons of risk scores for patients between four T stages. Risk scores of patients with stage T1 were significantly lower than those with stage T2 and those with stage T3. ****p < 0.0001. (G) Comparison of risk scores for patients between two survival statuses. The risk scores for the living LUAD patients were significantly lower than those for dead patients. ****p < 0.0001. (H) Comparisons of risk scores for patients between three cancer statuses. The risk scores for patients with tumor free were significantly lower than those with discrepancy tumor. *p < 0.05 and ***p < 0.001. (I) Gene set variation analysis. At the correlation of risk score with KEGG pathway > 0.4 or < -0.4 and p < 0.001, thirteen KEGG pathways were positively correlated with risk score. (J) Correlations of risk score with KEGG pathways. There was a strong positive correlation between risk score and 13 KEGG pathways. ***p < 0.001. (K) Top 5 KEGG pathways enriched in the high-risk group. Five KEGG pathways were separately cell cycle, DNA replication, homologous recombination, oocyte meiosis and P53 signaling pathway. (L) Top 5 KEGG pathways enriched in the low-risk group. Five KEGG pathways were separately ALPHA linolenic acid metabolism, cell adhesion molecules (CAMs), Fc epsilon RI signaling pathway, long term depression and viral myocarditis.