Submit an Article
Navigate
Home
Editorial Board
Editorial Policies
Current Volume
Archive
Scientific Integrity
Publication Ethics Statements
Interviews with Outstanding Authors
Newsroom
Sponsored Conferences
Podcast
Contact
Special Collections
Submit an Article
Online ISSN: 1945-4589
Research Paper
|
Volume 15, Issue 21
|
pp. 12296–12313
A systematic framework for identifying prognostic necroptosis-related lncRNAs and verification of lncRNA CRNDE/miR-23b-3p/IDH1 regulatory axis in glioma
Back to article
Figure 6
(6 of 10)
−
100%
+
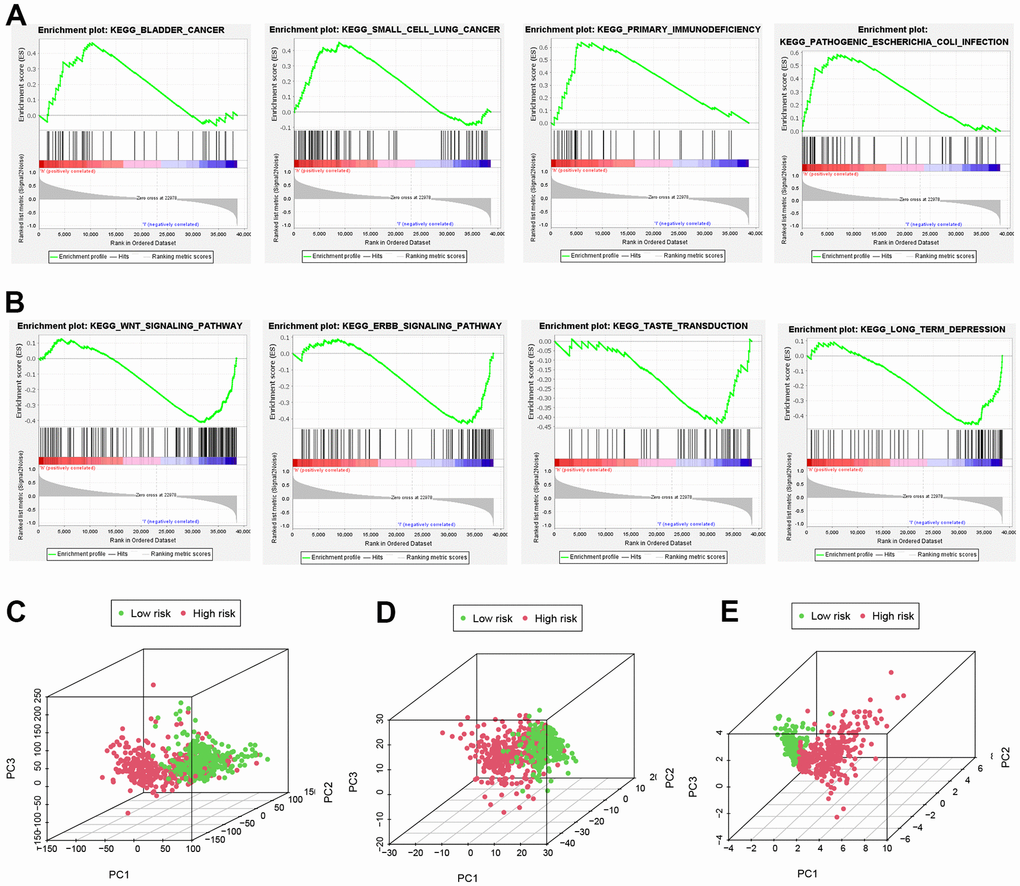
Figure 6.
Important pathways and PCA analyses.
(
A
,
B
) GSEA analysis. (
C
,
D
) All NRGs, lncRNAs and (
E
) NRLs in PCA analysis using 3D scatterplot.