Submit an Article
Navigate
Home
Editorial Board
Editorial Policies
Current Volume
Archive
Scientific Integrity
Publication Ethics Statements
Interviews with Outstanding Authors
Newsroom
Sponsored Conferences
Podcast
Contact
Special Collections
Submit an Article
Online ISSN: 1945-4589
Research Paper
|
Volume 15, Issue 21
|
pp. 12275–12295
Identification of M5c regulator-medicated methylation modification patterns for prognosis and immune microenvironment in glioma
Back to article
Figure 8
(8 of 9)
−
100%
+
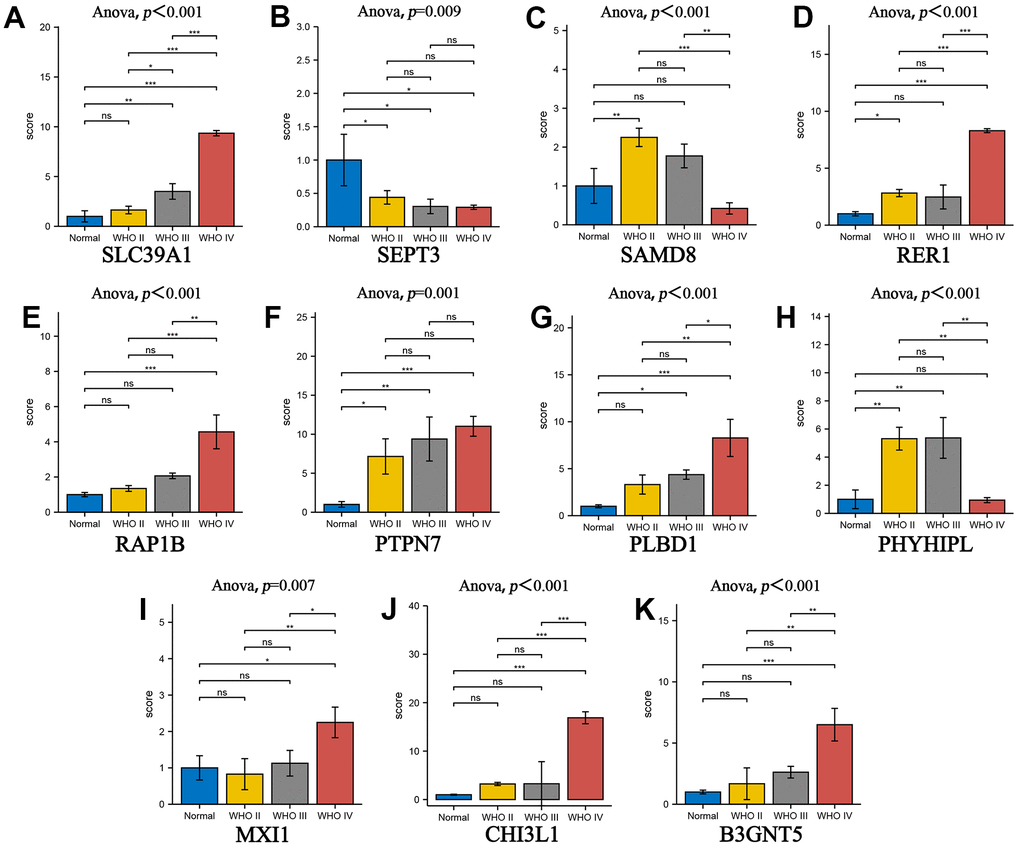
Figure 8.
The gene of prognostic model was used to verify the correlation of glioma grade by RT-qPCR.
(
A
–
K
) The box plot comparing the expression of key genes in different glioma grades. *P < 0.05; **P < 0.01; ***P < 0.001.