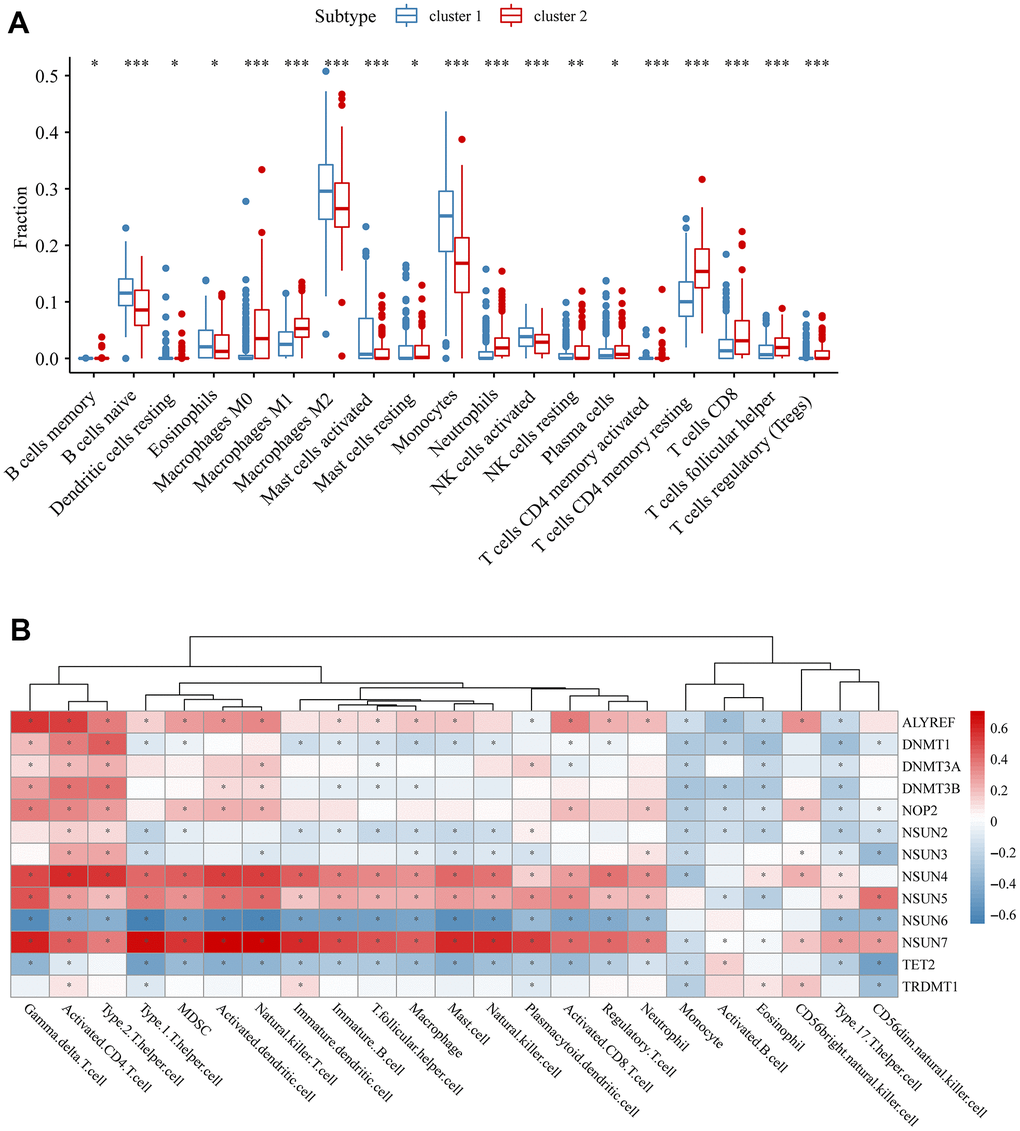
Figure 4.The relationship between m5c and immune. (A) The abundance of each immune cell in two clusters. The lines in the boxes were the median values. The asterisks represented the p values (*P < 0.05; **P < 0.01; ***P < 0.001). (B) Spearman correlation analysis of immune score and m5c genes.