Submit an Article
Navigate
Home
Editorial Board
Editorial Policies
Current Volume
Archive
Scientific Integrity
Publication Ethics Statements
Interviews with Outstanding Authors
Newsroom
Sponsored Conferences
Podcast
Contact
Special Collections
Submit an Article
Online ISSN: 1945-4589
Research Paper
|
Volume 15, Issue 21
|
pp. 12068–12084
The role of m6A RNA methylation regulator in meningioma
Back to article
Figure 4
(4 of 7)
−
100%
+
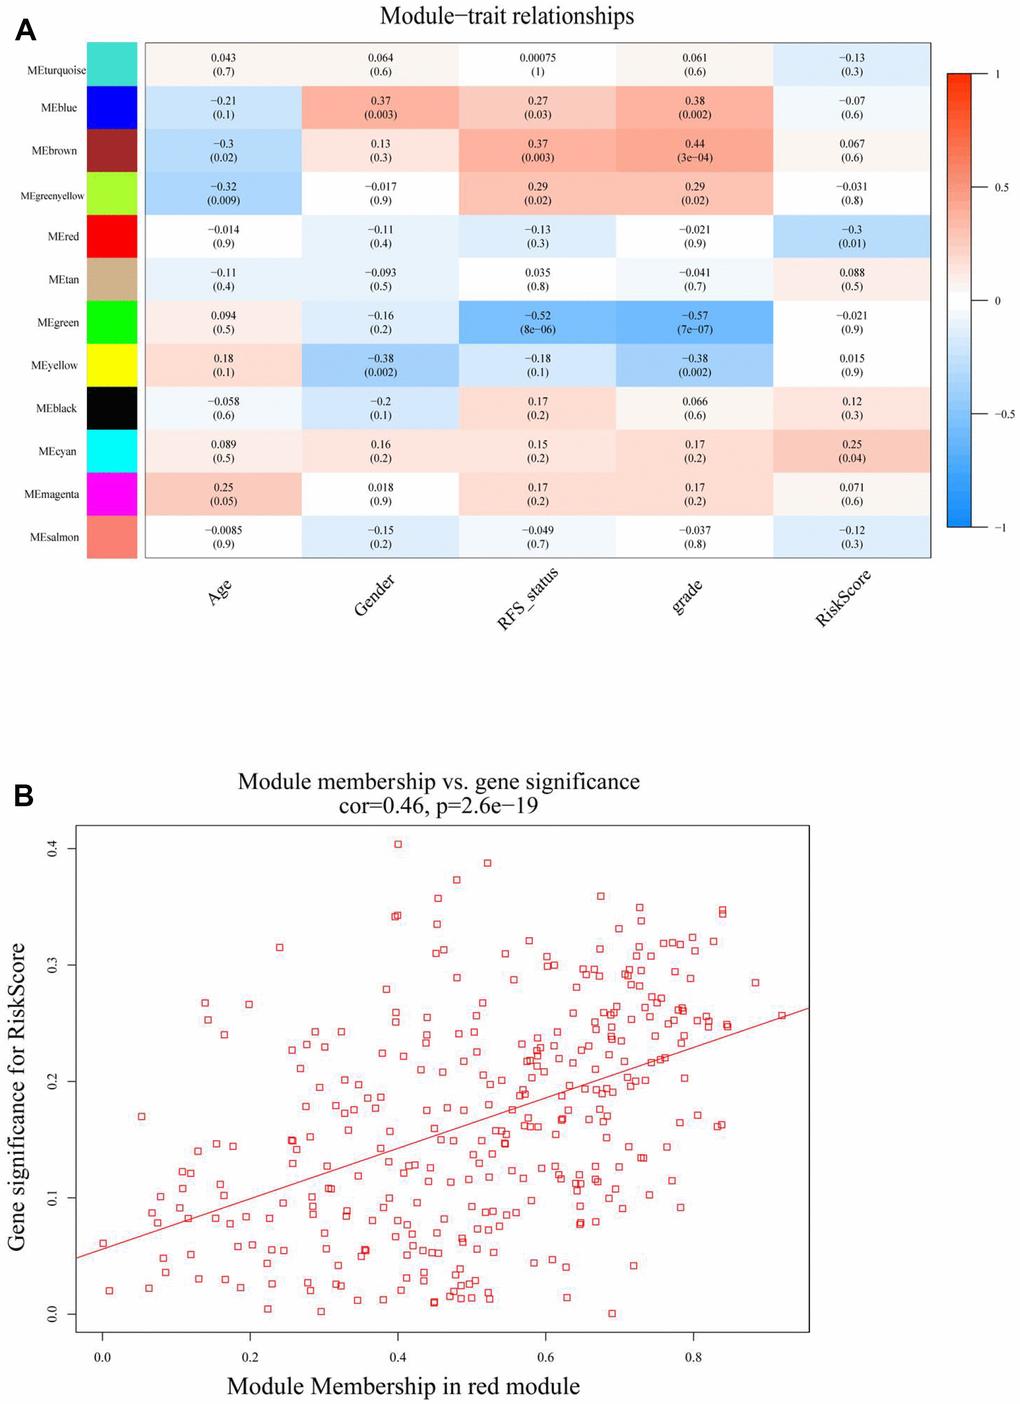
Figure 4.
(
A
) Heatmap of the correlation between module (MEs) and trait characteristics (included RiskScore) of meningioma. (
B
) The correlation analysis between module membership (MM) in red module and gene significance (GS) for RiskScore.