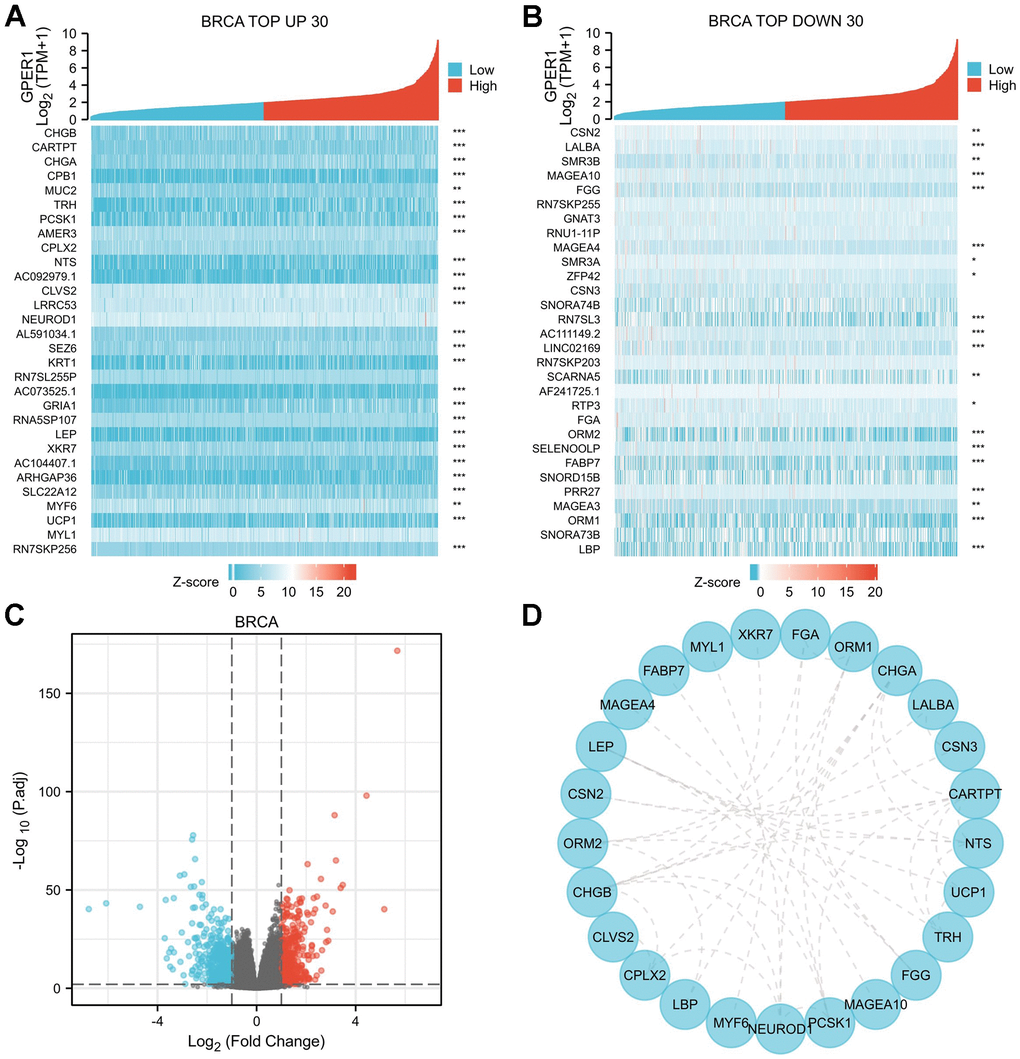
Figure 7.DEGs of high and low GPER1 expression in BRCA and PPI network of DEGs. (A) The heatmap of top 30 up-regulated DEGs, (B) The heatmap of top 30 down-regulated DEGs. Each square represents the expression value of other molecules after undergoing Z-score transformation across various samples (Z-score involves subtracting the mean expression value of each molecule in individual samples from its mean expression value across all samples and then dividing by the standard deviation), with color intensity indicating the absolute value of the expression level. (C) The volcano plots of DEGs between high and low GPER1 expression groups, (D) PPI network of DEGs of high and low GPER1 expression in BRCA. * p < 0.05, ** p < 0.01, *** p < 0.001. The “p” value represents the p-value obtained from the Spearman test conducted to calculate the correlation coefficient between GPER1 and the top 30 up- and downregulated genes.