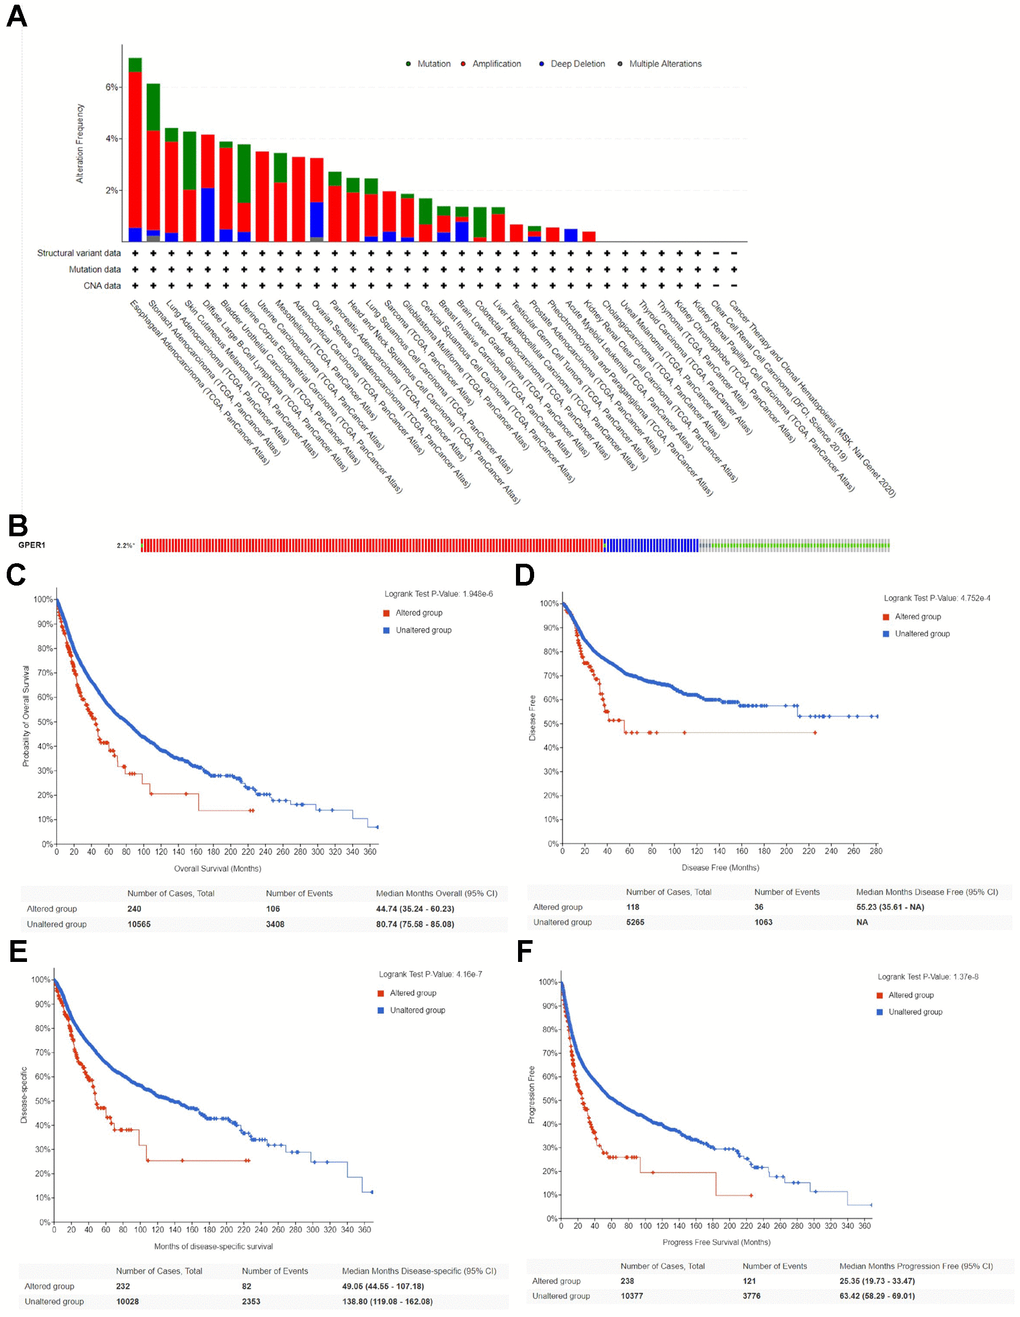
Figure 6.Genetic alteration of GPER1 in pan-cancer. (A) Bar chart of GPER1 mutation in pan-cancer based on TCGA database. (B) The alteration frequency with different types of GPER1 gene mutations in pan-cancer. Kaplan-Meier curve of (C) OS, (D) DSS, (E) DFS, (F) PFS in pan-cancer patients with altered (red) and unaltered (blue) mRNA expression of the GPER1 gene.