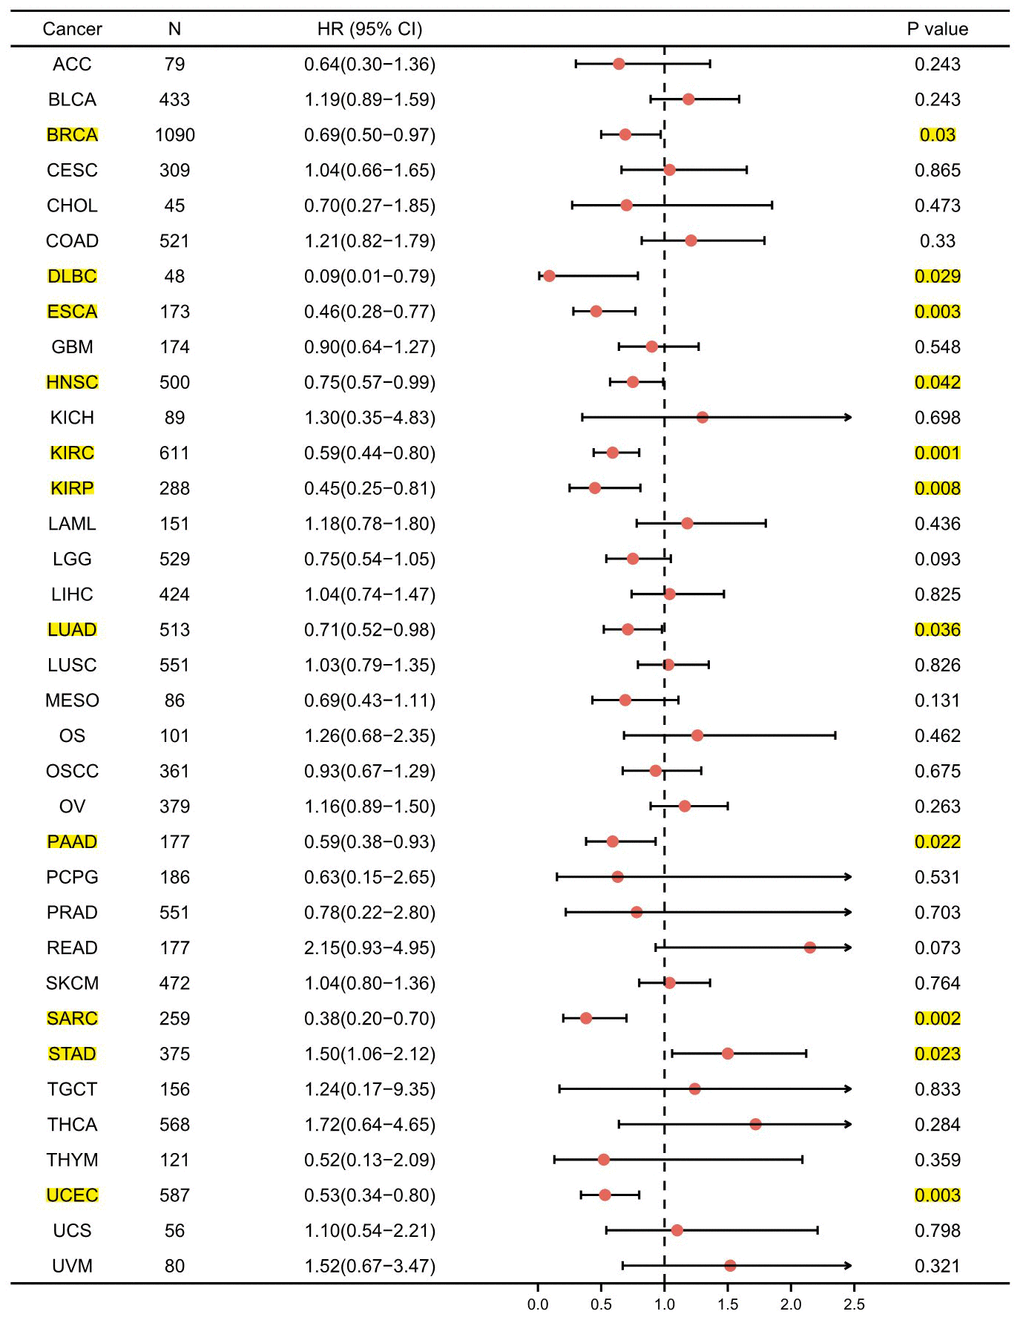
Figure 4.Forest plot of GPER1 OS in 35 cancer types. The marked yellow cancer species indicated that the p-value of prognostic K-M analysis for high- and low- GPER1 gene expression in the cancer species (BRCA, DLBC, ESCA, HNSC, KIRC, KIRP, LUAD, PAAD, SARC, STAD, UCEC) were less than 0.05.