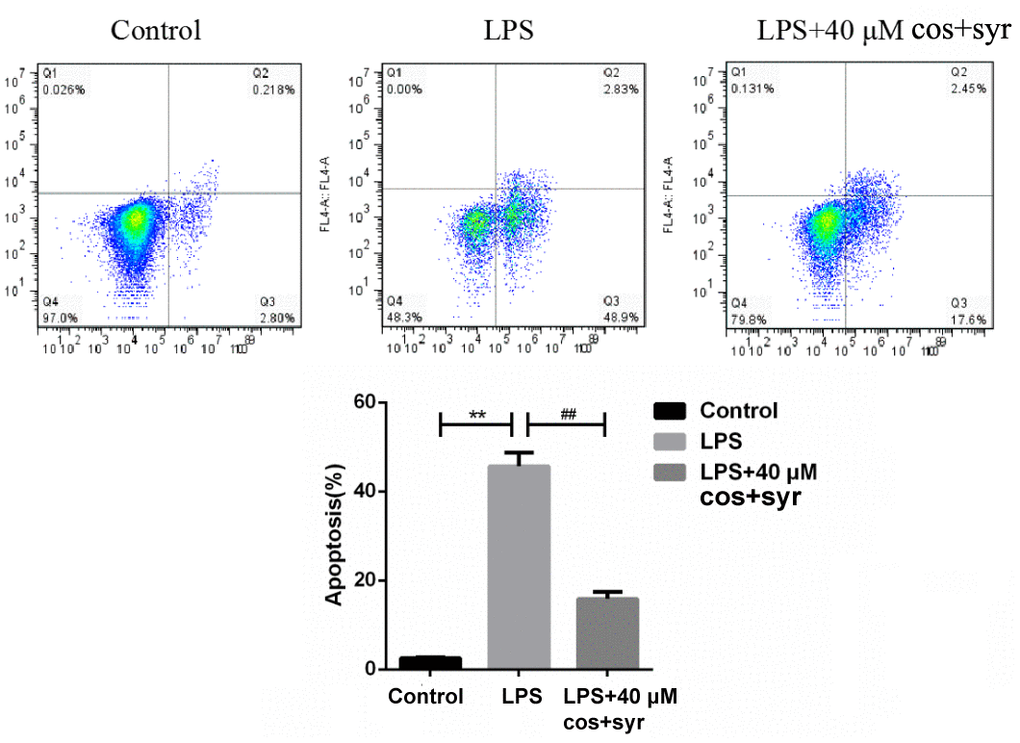
Figure 5.The results of annexin V and PI double staining after syr+cos treatment (L-02 cells were treated with 40 μM for 48 h, the apoptotic cells were quantified by flow cytometry). Note: The data represent the mean ± SD per group. **P < 0.01 vs control group; ##P < 0.01 vs LPS treatment group.