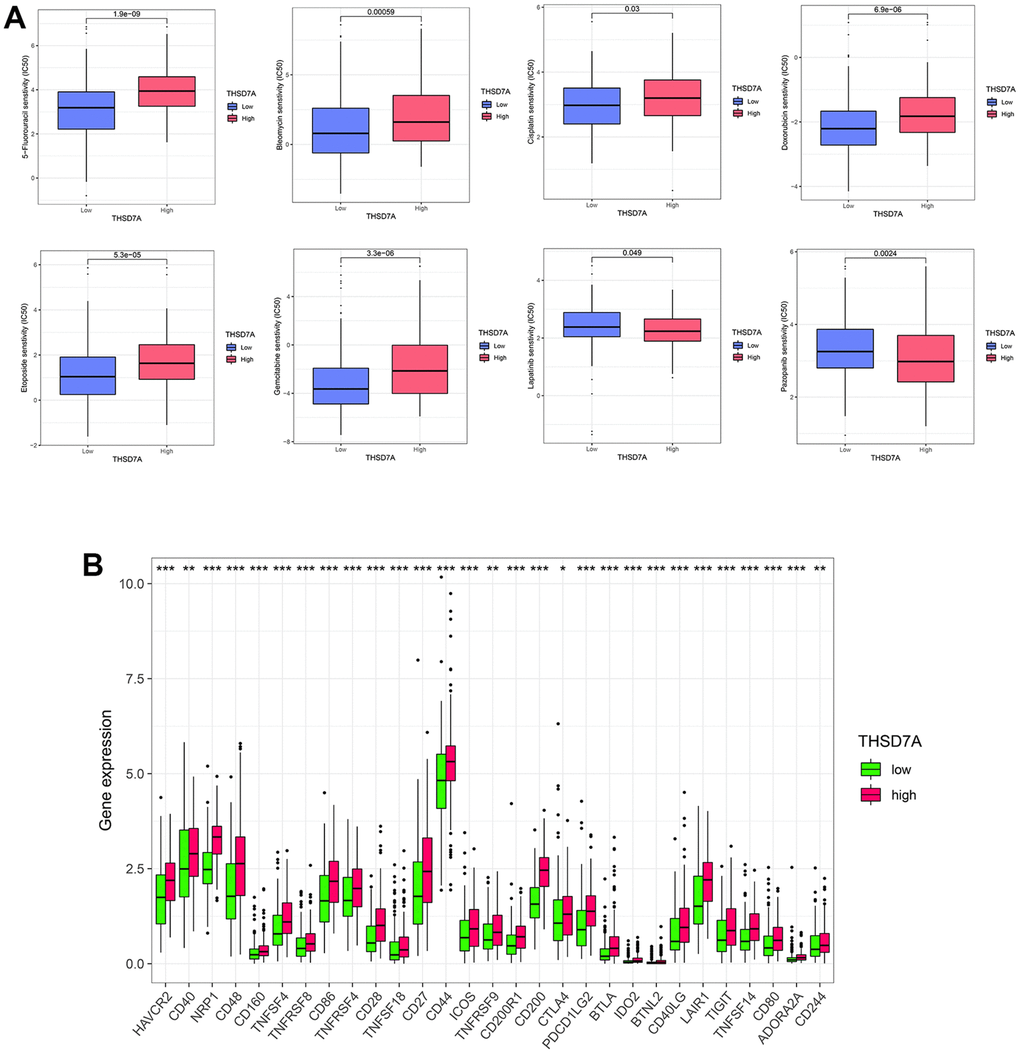
Figure 7.Analysis of drug sensitivity and immune checkpoints. (A) Correlation between high- and low-THSD7A expression subgroups and the sensitivity to different anti-tumor drugs. (B) Expression of immune checkpoints in the high- and low-THSD7A expression groups (*: P<0.05, **: P<0.01, ***: P<0.001).