Submit an Article
Navigate
Home
Editorial Board
Editorial Policies
Current Volume
Archive
Scientific Integrity
Publication Ethics Statements
Interviews with Outstanding Authors
Newsroom
Sponsored Conferences
Podcast
Contact
Special Collections
Submit an Article
Online ISSN: 1945-4589
Research Paper
|
Volume 15, Issue 21
|
pp. 11891–11917
Comprehensive analysis reveals XCL2 as a cancer prognosis and immune infiltration-related biomarker
Back to article
Figure 4
(4 of 12)
−
100%
+
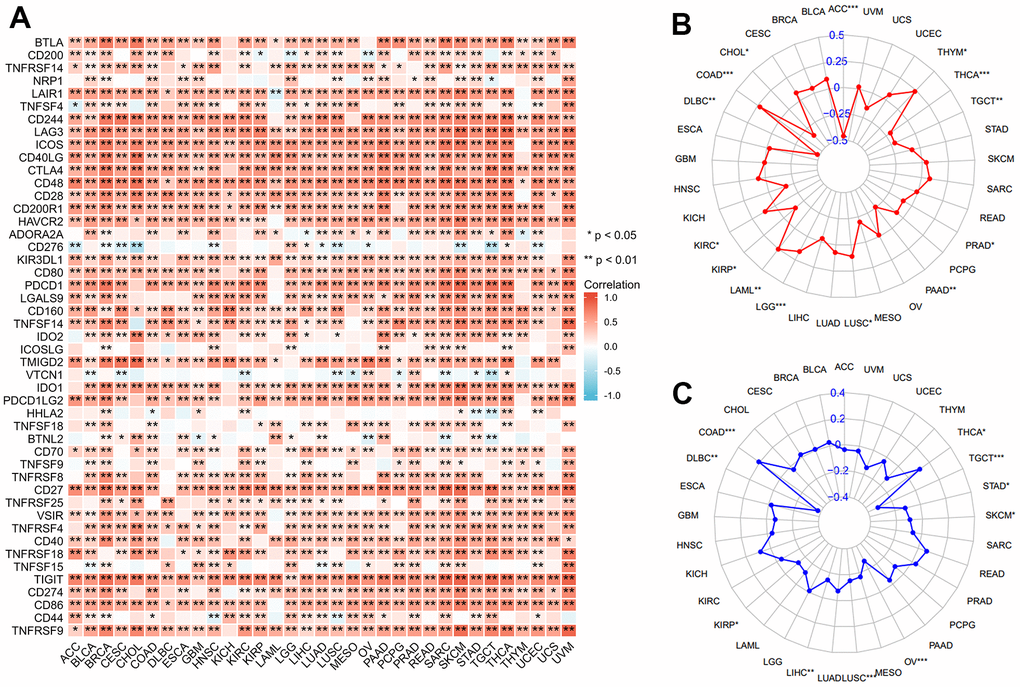
Figure 4.
Correlation of XCL2 with immune checkpoint genes, TMB, and MSI.
Correlation between XCL2 expression and immune checkpoint genes (
A
), TMB (
B
), and MSI (
C
) (*P < 0.05, **P < 0.01, ***P < 0.001).
Figure 4 — Comprehensive analysis reveals XCL2 as a cancer prognosis and immune infiltration-related biomarker | Aging